Friday, March 31, 2023
New – Ready-to-use Models and Support for Custom Text and Image Classification Models in Amazon SageMaker Canvas
Today AWS announces new features in Amazon SageMaker Canvas that help business analysts generate insights from thousands of documents, images, and lines of text in minutes with machine learning (ML). Starting today, you can access ready-to-use models and create custom text and image classification models alongside previously supported custom models for tabular data, all without requiring ML experience or writing a line of code.
Business analysts across different industries want to apply AI/ML solutions to generate insights from a variety of data and respond to ad-hoc analysis requests coming from business stakeholders. By applying AI/ML in their workflows, analysts can automate manual, time-consuming, and error-prone processes, such as inspection, classification, as well as extraction of insights from raw data, images, or documents. However, applying AI/ML to business problems requires technical expertise and building custom models can take several weeks or even months.
Launched in 2021, Amazon SageMaker Canvas is a visual, point-and-click service that allows business analysts to use a variety of ready-to-use models or create custom models to generate accurate ML predictions on their own.
Ready-to-use Models
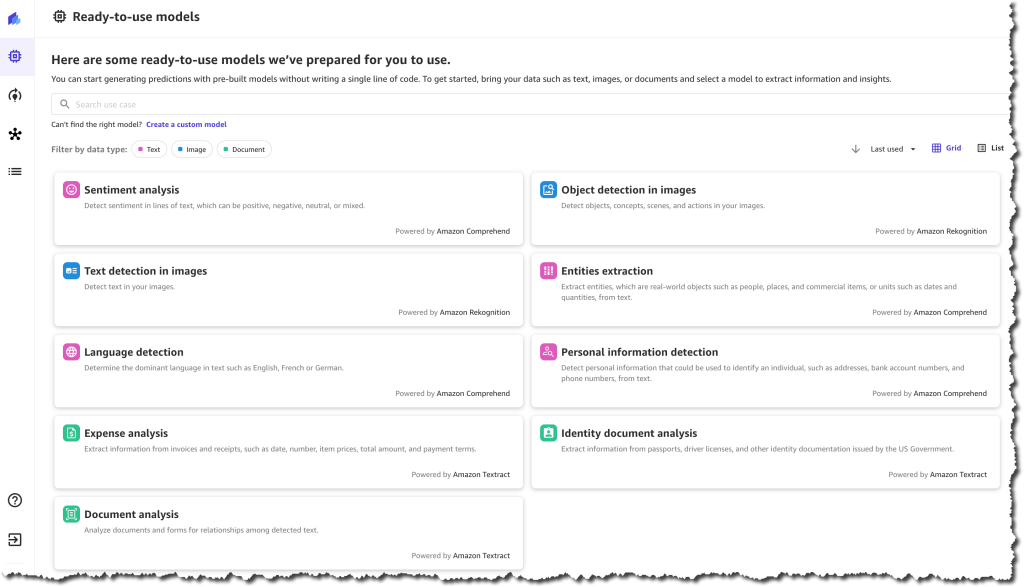
Customers can use SageMaker Canvas to access ready-to-use models that can be used to extract information and generate predictions from thousands of documents, images, and lines of text in minutes. These ready-to-use models include sentiment analysis, language detection, entity extraction, personal information detection, object and text detection in images, expense analysis for invoices and receipts, identity document analysis, and more generalized document and form analysis.
For example, you can select the sentiment analysis ready-to-use model and upload product reviews from social media and customer support tickets to quickly understand how your customers feel about your products. Using the personal information detection ready-to-use model, you can detect and redact personally identifiable information (PII) from emails, support tickets, and documents. Using the expense analysis ready-to-use model, you can easily detect and extract data from your scanned invoices and receipts and generate insights about that data.
These ready-to-use models are powered by AWS AI services, including Amazon Rekognition, Amazon Comprehend, and Amazon Textract.
Custom Text and Image Classification Models
Customers that need custom models trained for their business-specific use-case can use SageMaker Canvas to create text and image classification models.
You can use SageMaker Canvas to create custom text classification models to classify data according to your needs. For example, imagine that you work as a business analyst at a company that provides customer support. When a customer support agent engages with a customer, they create a ticket, and they need to record the ticket type, for example, “incident”, “service request”, or “problem”. Many times, this field gets forgotten, and so, when the reporting is done, the data is hard to analyze. Now, using SageMaker Canvas, you can create a custom text classification model, train it with existing customer support ticket information and ticket type, and use it to predict the type of tickets in the future when working on a report with missing data.
You can also use SageMaker Canvas to create custom image classification models using your own image datasets. For instance, imagine you work as a business analyst at a company that manufactures smartphones. As part of your role, you need to prepare reports and respond to questions from business stakeholders related to quality assessment and it’s trends. Every time a phone is assembled, a picture is automatically taken, and at the end of the week, you receive all those images. Now with SageMaker Canvas, you can create a new custom image classification model that is trained to identify common manufacturing defects. Then, every week, you can use the model to analyze the images and predict the quality of the phones produced.
SageMaker Canvas in Action
Let’s imagine that you are a business analyst for an e-commerce company. You have been tasked with understanding the customer sentiment towards all the new products for this season. Your stakeholders require a report that aggregates the results by item category to decide what inventory they should purchase in the following months. For example, they want to know if the new furniture products have received positive sentiment. You have been provided with a spreadsheet containing reviews for the new products, as well as an outdated file that categorizes all the products on your e-commerce platform. However, this file does not yet include the new products.
To solve this problem, you can use SageMaker Canvas. First, you will need to use the sentiment analysis ready-to-use model to understand the sentiment for each review, classifying them as positive, negative, or neutral. Then, you will need to create a custom text classification model that predicts the categories for the new products based on the existing ones.
Ready-to-use Model – Sentiment Analysis
To quickly learn the sentiment of each review, you can do a bulk update of the product reviews and generate a file with all the sentiment predictions.
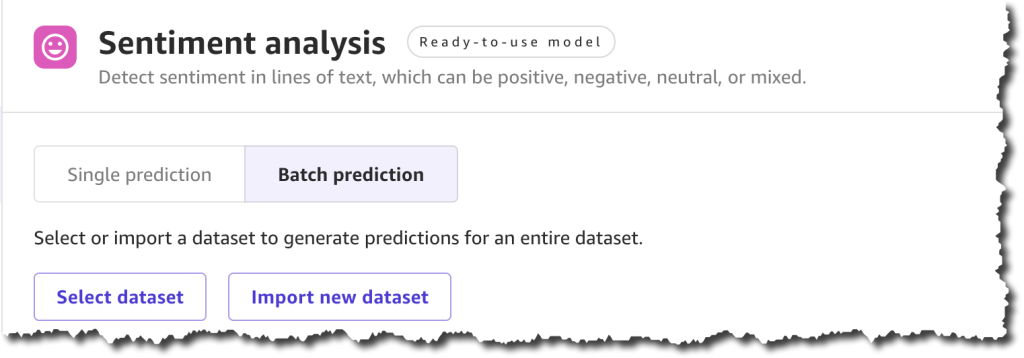
To get started, locate Sentiment analysis on the Ready-to-use models page, and under Batch prediction, select Import new dataset.
When you create a new dataset, you can upload the dataset from your local machine or use Amazon Simple Storage Service (Amazon S3). For this demo, you will upload the file locally. You can find all the product reviews used in this example in the Amazon Customer Reviews dataset.
After you complete uploading the file and creating the dataset, you can Generate predictions.
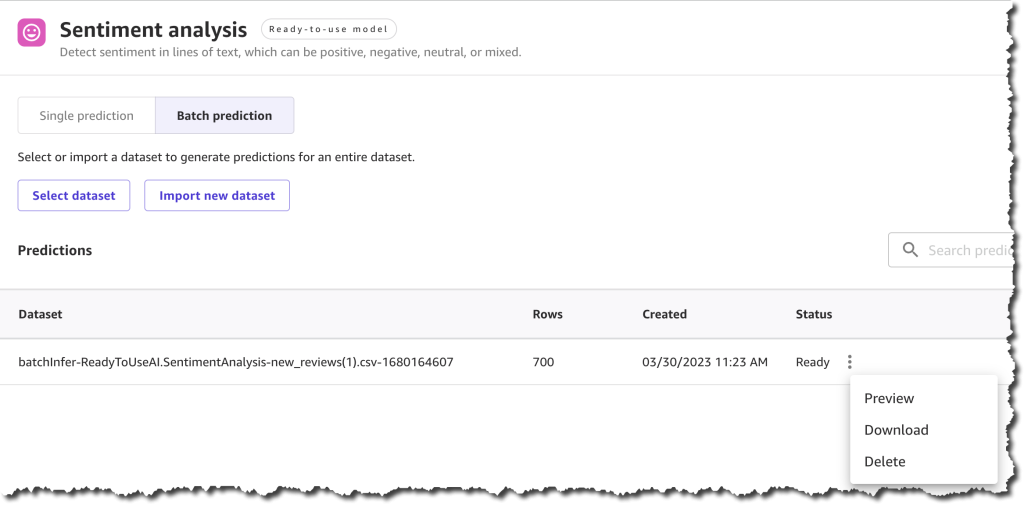
The prediction generation takes less than a minute, depending on the size of the dataset, and then you can view or download the results.
The results from this prediction can be downloaded as a .csv file or viewed from the SageMaker Canvas interface. You can see the sentiment for each of the product reviews.
Now you have the first part of your task ready—you have a .csv file with the sentiment of each review. The next step is to classify those products into categories.
Custom Text Classification Model
To classify the new products into categories based on the product title, you need to train a new text classification model in SageMaker Canvas.
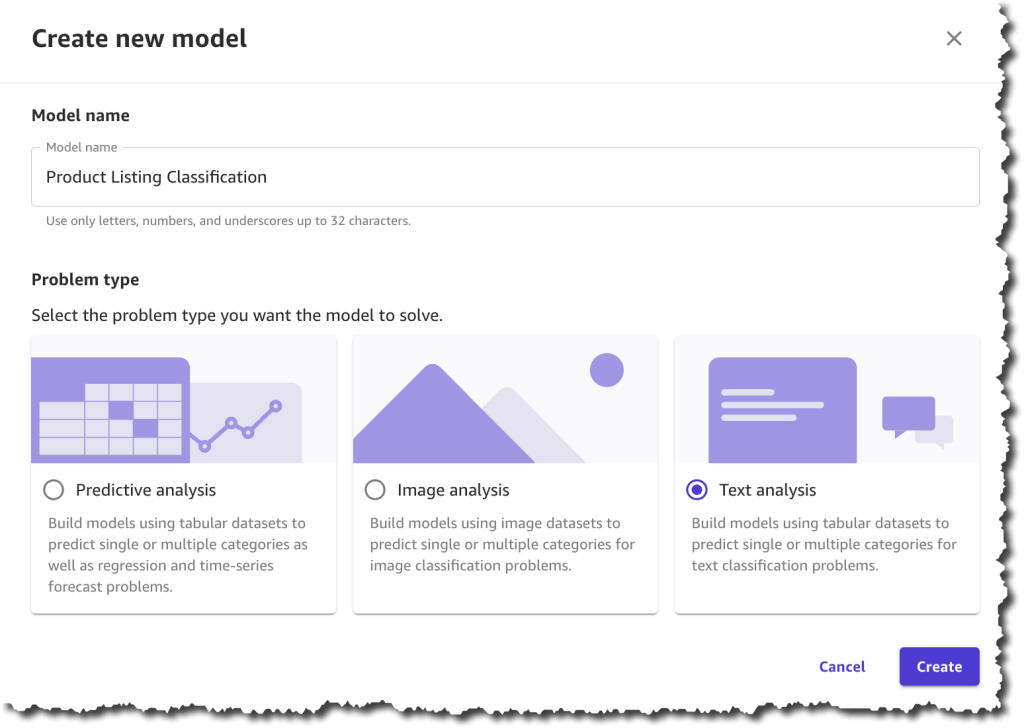
In SageMaker Canvas, create a New model of the type Text analysis.
The first step when creating the model is to select a dataset with which to train the model. You will train this model with a dataset from last season, which contains all the products except for the new collection.
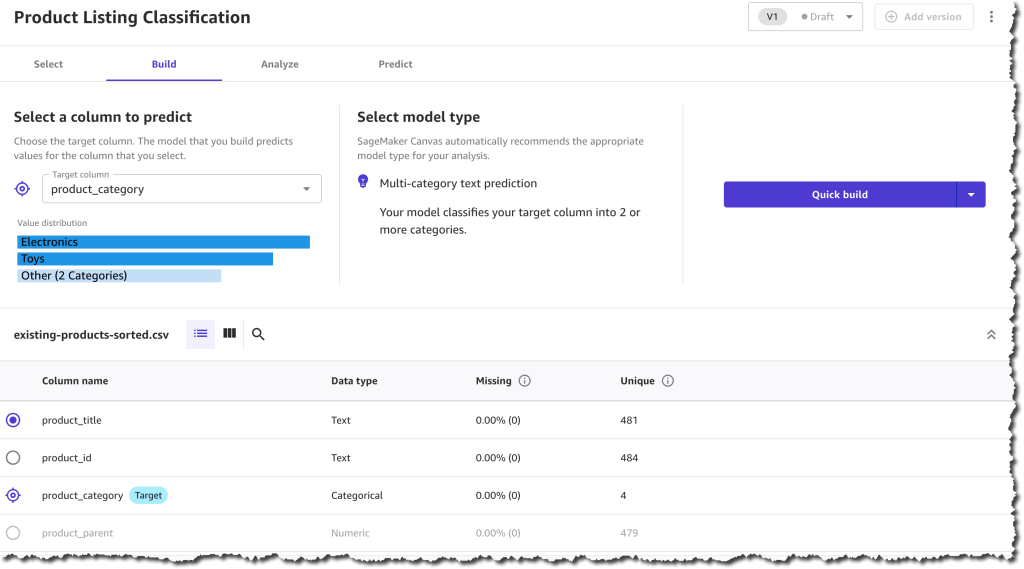
Once the dataset has finished importing, you will need to select the column that contains the data you want to predict, which in this case is the product_category column, and the column that will be used as the input for the model to make predictions, which is the product_title column.
After you finish configuring that, you can start to build the model. There are two modes of building:
- Quick build that returns a model in 15–30 minutes.
- Standard build takes 2–5 hours to complete.
To learn more about the differences between the modes of building you can check the documentation. For this demo, pick quick build, as our dataset is smaller than 50,000 rows.
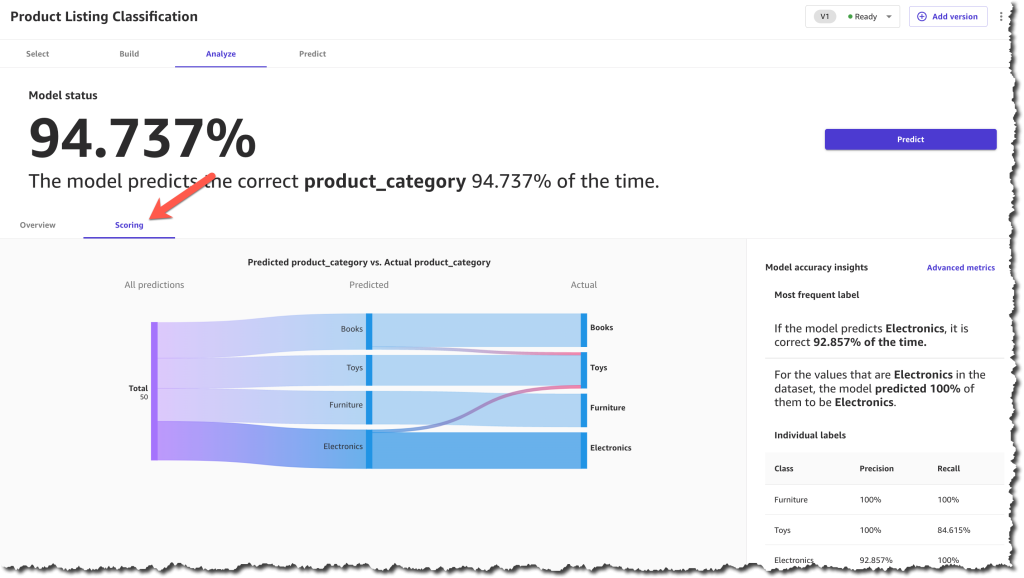
When the model is built, you can analyze how the model performs. SageMaker Canvas uses the 80-20 approach; it trains the model with 80 percent of the data from the dataset and uses 20 percent of the data to validate the model.
When the model finishes building, you can check the model score. The scoring section gives you a visual sense of how accurate the predictions were for each category. You can learn more about how to evaluate your model’s performance in the documentation.
After you make sure that your model has a high prediction rate, you can move on to generate predictions. This step is similar to the ready-to-use models for sentiment analysis. You can make a prediction on a single product or on a set of products. For a batch prediction, you need to select a dataset and let the model generate the predictions. For this example, you will select the same dataset that you selected in the ready-to-use model, the one with the reviews. This can take a few minutes, depending on the number of products in the dataset.
When the predictions are ready, you can download the results as a .csv file or view how each product was classified. In the prediction results, each product is assigned only one category based on the categories provided during the model-building process.
Now you have all the necessary resources to conduct an analysis and evaluate the performance of each product category with the new collection based on customer reviews. Using SageMaker Canvas, you were able to access a ready-to-use model and create a custom text classification model without having to write a single line of code.
Available Now
Ready-to-use models and support for custom text and image classification models in SageMaker Canvas are available in all AWS Regions where SageMaker Canvas is available. You can learn more about the new features and how they are priced by visiting the SageMaker Canvas product detail page.
— Marcia
from AWS News Blog https://ift.tt/D7lI8xX
via IFTTT
Simplify Service-to-Service Connectivity, Security, and Monitoring with Amazon VPC Lattice – Now Generally Available
Simplify Service-to-Service Connectivity, Security, and Monitoring with Amazon VPC Lattice – Now Generally Available
At AWS re:Invent 2022, we introduced in preview Amazon VPC Lattice, a new capability of Amazon Virtual Private Cloud (Amazon VPC) that gives you a consistent way to connect, secure, and monitor communication between your services. With VPC Lattice, you can define policies for network access, traffic management, and monitoring to connect compute services across instances, containers, and serverless applications.
Today, I am happy to share that VPC Lattice is now generally available. Compared to the preview, you have access to new capabilities:
- Services can use a custom domain name in addition to the domain name automatically generated by VPC Lattice. When using HTTPS, you can configure an SSL/TLS certificate that matches the custom domain name.
- You can deploy the open-source AWS Gateway API Controller to use VPC Lattice with a Kubernetes-native experience. It uses the Kubernetes Gateway API to let you connect services across multiple Kubernetes clusters and services running on EC2 instances, containers, and serverless functions.
- You can use an Application Load Balancer (ALB) or a Network Load Balancer (NLB) as a target for a service.
- The IP address target type now supports IPv6 connectivity.
Let’s see some of these new features in practice.
Using Amazon VPC Lattice for Service-to-Service Connectivity
In my previous post introducing VPC Lattice, I show how to create a service network, associate multiple VPCs and services, and configure target groups for EC2 instances and Lambda functions. There, I also show how to route traffic based on request characteristics and how to use weighted routing. Weighted routing is really handy for blue/green and canary-style deployments or for migrating from one compute platform to another.
Now, let’s see how to use VPC Lattice to allow the services of an e-commerce application to communicate with each other. For simplicity, I only consider four services:
- The
Orderservice, running as a Lambda function. - The
Inventoryservice, deployed as an Amazon Elastic Container Service (Amazon ECS) service in a dual-stack VPC supporting IPv6. - The
Deliveryservice, deployed as an ECS service using an ALB to distribute traffic to the service tasks. - The
Paymentservice, running on an EC2 instance.
First, I create a service network. The Order service needs to call the Inventory service (to check if an item is available for purchase), the Delivery service (to organize the delivery of the item), and the Payment service (to transfer the funds). The following diagram shows the service-to-service communication from the perspective of the service network.
These services run in different AWS accounts and multiple VPCs. VPC Lattice handles the complexity of setting up connectivity across VPC boundaries and permission across accounts so that service-to-service communication is as simple as an HTTP/HTTPS call.
The following diagram shows how the communication flows from an implementation point of view.
The Order service runs in a Lambda function connected to a VPC. Because all the VPCs in the diagram are associated with the service network, the Order service is able to call the other services (Inventory, Delivery, and Payment) even if they are deployed in different AWS accounts and in VPCs with overlapping IP addresses.
Using a Network Load Balancer (NLB) as Target
The Inventory service runs in a dual-stack VPC. It’s deployed as an ECS service with an NLB to distribute traffic to the tasks in the service. To get the IPv6 addresses of the NLB, I look for the network interfaces used by the NLB in the EC2 console.
When creating the target group for the Inventory service, under Basic configuration, I choose IP addresses as the target type. Then, I select IPv6 for the IP Address type.
In the next step, I enter the IPv6 addresses of the NLB as targets. After the target group is created, the health checks test the targets to see if they are responding as expected.
Using an Application Load Balancer (ALB) as Target
Using an ALB as a target is even easier. When creating a target group for the Delivery service, under Basic configuration, I choose the new Application Load Balancer target type.
I select the VPC in which to look for the ALB and choose the Protocol version.
In the next step, I choose Register now and select the ALB from the dropdown. I use the default port used by the target group. VPC Lattice does not provide additional health checks for ALBs. However, load balancers already have their own health checks configured.
Using Custom Domain Names for Services
To call these services, I use custom domain names. For example, when I create the Payment service in the VPC console, I choose to Specify a custom domain configuration, enter a Custom domain name, and select an SSL/TLS certificate for the HTTPS listener. The Custom SSL/TLS certificate dropdown shows available certificates from AWS Certificate Manager (ACM).
Securing Service-to-Service Communications
Now that the target groups have been created, let’s see how I can secure the way services communicate with each other. To implement zero-trust authentication and authorization, I use AWS Identity and Access Management (IAM). When creating a service, I select the AWS IAM as Auth type.
I select the Allow only authenticated access policy template so that requests to services need to be signed using Signature Version 4, the same signing protocol used by AWS APIs. In this way, requests between services are authenticated by their IAM credentials, and I don’t have to manage secrets to secure their communications.
Optionally, I can be more precise and use an auth policy that only gives access to some services or specific URL paths of a service. For example, I can apply the following auth policy to the Order service to give to the Lambda function these permissions:
- Read-only access (GET method) to the
Inventoryservice/stockURL path. - Full access (any HTTP method) to the
Deliveryservice/deliveryURL path.
{
    "Version": "2012-10-17",
    "Statement": [
        {
            "Effect": "Allow",
            "Principal": {
                "AWS": "<Order Service Lambda Function IAM Role ARN>"
            },
            "Action": "vpc-lattice-svcs:Invoke",
            "Resource": "<Inventory Service ARN>/stock",
            "Condition": {
                "StringEquals": {
                    "vpc-lattice-svcs:RequestMethod": "GET"
                }
            }
        },
        {
            "Effect": "Allow",
            "Principal": {
                "AWS": "<Order Service Lambda Function IAM Role ARN>"
            },
            "Action": "vpc-lattice-svcs:Invoke",
            "Resource": "<Delivery Service ARN>/delivery"
        }
    ]
}
Using VPC Lattice, I quickly configured the communication between the services of my e-commerce application, including security and monitoring. Now, I can focus on the business logic instead of managing how services communicate with each other.
Availability and Pricing
Amazon VPC Lattice is available today in the following AWS Regions: US East (Ohio), US East (N. Virginia), US West (Oregon), Asia Pacific (Singapore), Asia Pacific (Sydney), Asia Pacific (Tokyo), and Europe (Ireland).
With VPC Lattice, you pay for the time a service is provisioned, the amount of data transferred through each service, and the number of requests. There is no charge for the first 300,000 requests every hour, and you only pay for requests above this threshold. For more information, see VPC Lattice pricing.
We designed VPC Lattice to allow incremental opt-in over time. Each team in your organization can choose if and when to use VPC Lattice. Other applications can connect to VPC Lattice services using standard protocols such as HTTP and HTTPS. By using VPC Lattice, you can focus on your application logic and improve productivity and deployment flexibility with consistent support for instances, containers, and serverless computing.
Simplify the way you connect, secure, and monitor your services with VPC Lattice.
— Danilo
from AWS News Blog https://ift.tt/78yUNVP
via IFTTT
Thursday, March 30, 2023
Amazon GuardDuty Now Supports Amazon EKS Runtime Monitoring
Since Amazon GuardDuty launched in 2017, GuardDuty has been capable of analyzing tens of billions of events per minute across multiple AWS data sources, such as AWS CloudTrail event logs, Amazon Virtual Private Cloud (Amazon VPC) Flow Logs, and DNS query logs, Amazon Simple Storage Service (Amazon S3) data plane events, Amazon Elastic Kubernetes Service (Amazon EKS) audit logs, and Amazon Relational Database Service (Amazon RDS) login events to protect your AWS accounts and resources.
In 2020, GuardDuty added Amazon S3 protection to continuously monitor and profile S3 data access events and configurations to detect suspicious activities in Amazon S3. Last year, GuardDuty launched Amazon EKS protection to monitor control plane activity by analyzing Kubernetes audit logs from existing and new EKS clusters in your accounts, Amazon EBS malware protection to scan malicious files residing on an EC2 instance or container workload using EBS volumes, and Amazon RDS protection to identify potential threats to data stored in Amazon Aurora databases—recently generally available.
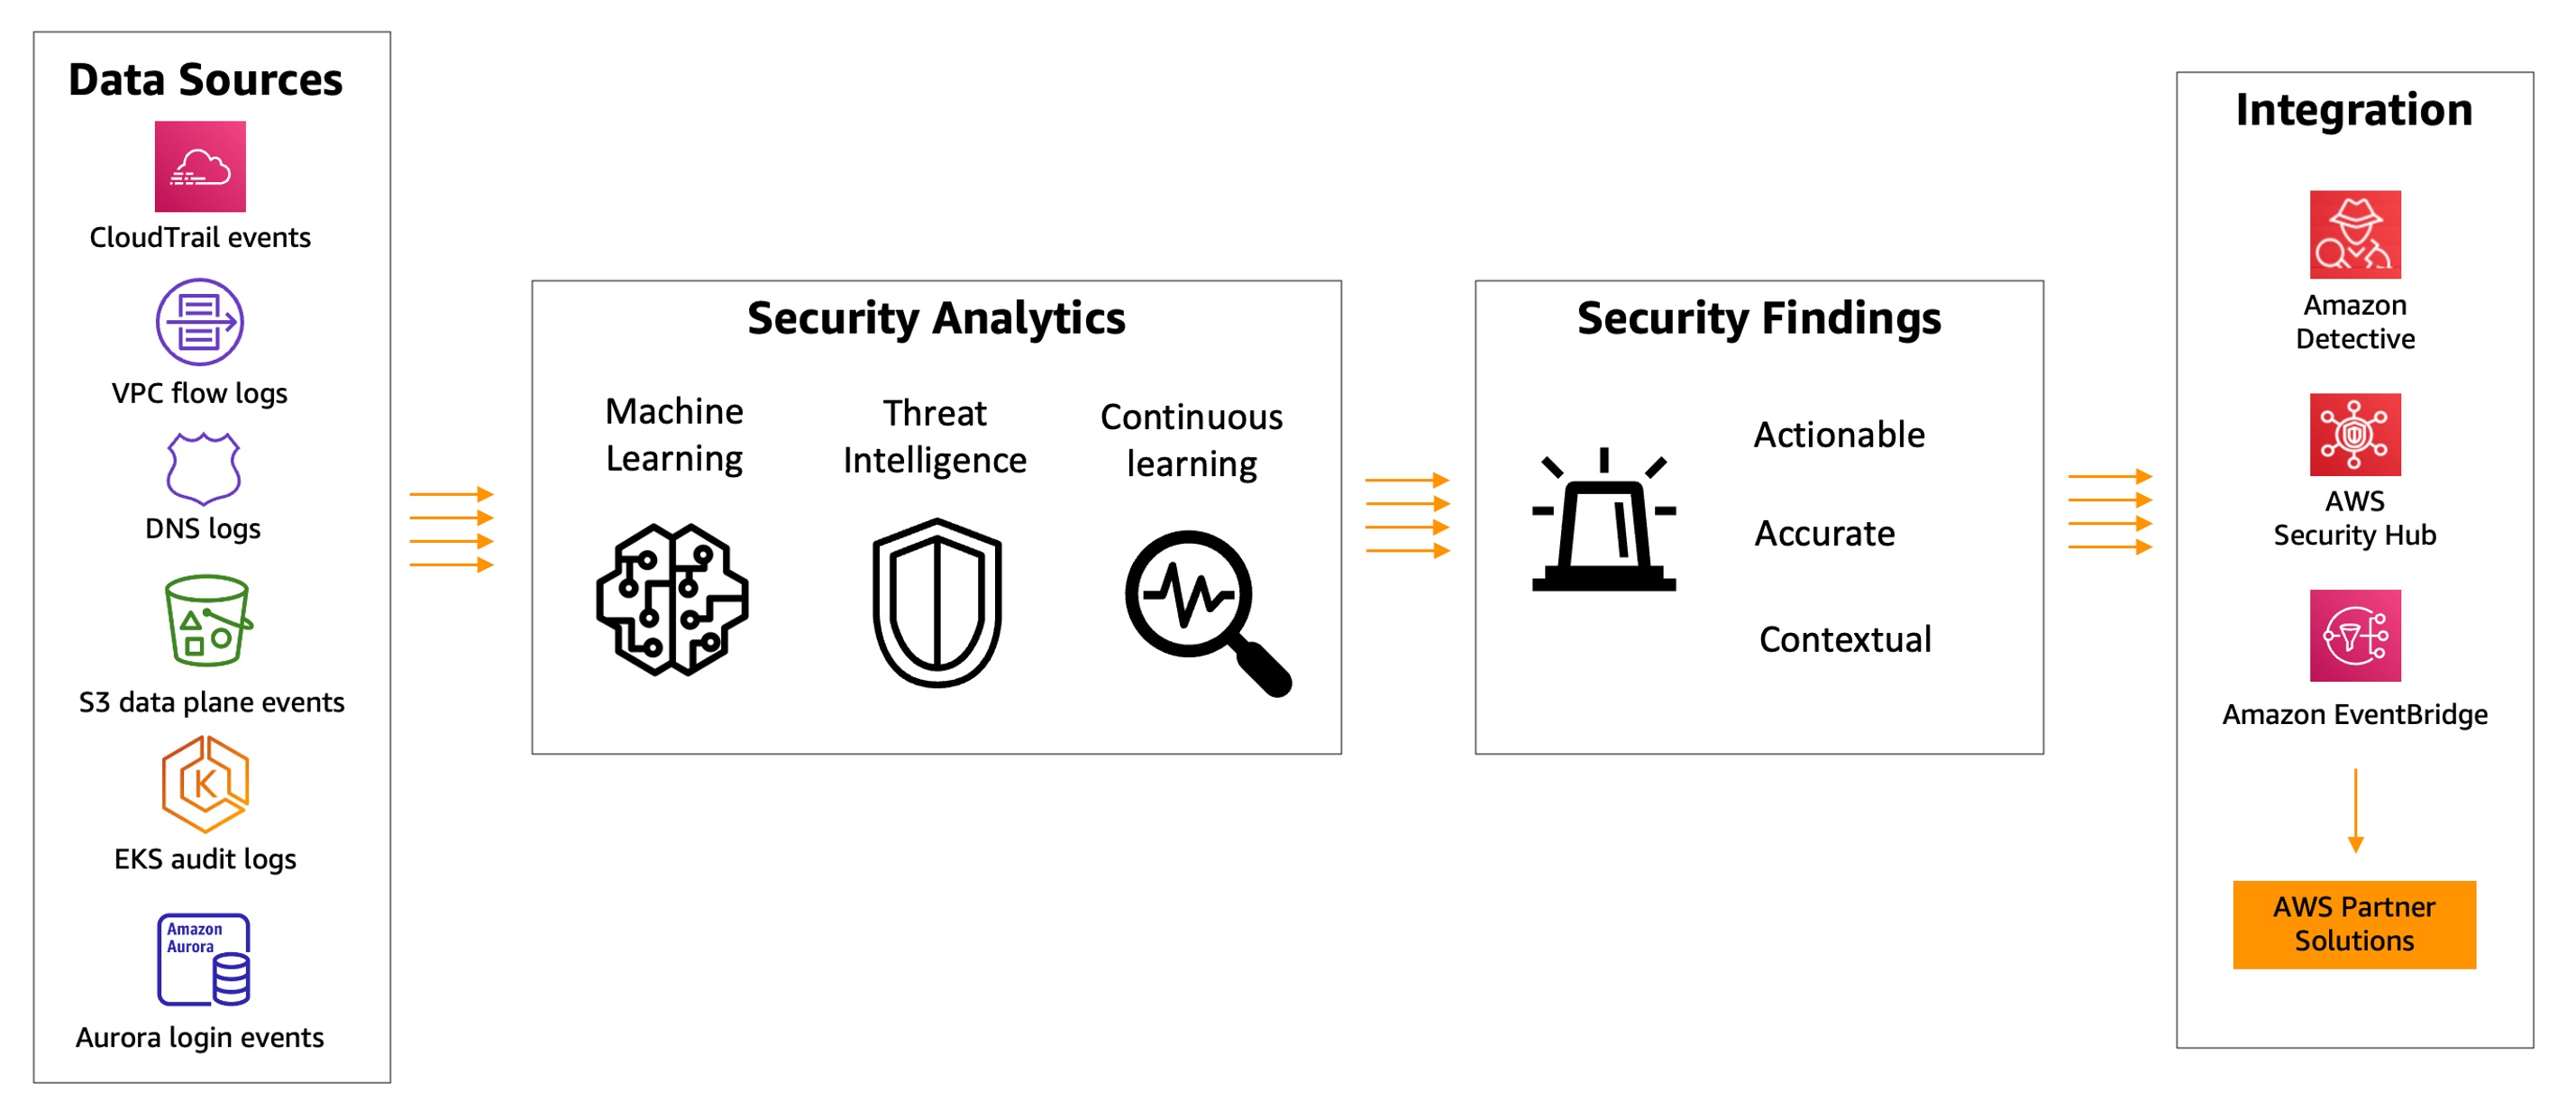
GuardDuty combines machine learning (ML), anomaly detection, network monitoring, and malicious file discovery using various AWS data sources. When threats are detected, GuardDuty automatically sends security findings to AWS Security Hub, Amazon EventBridge, and Amazon Detective. These integrations help centralize monitoring for AWS and partner services, automate responses to malware findings, and perform security investigations from GuardDuty.
Today, we are announcing the general availability of Amazon GuardDuty EKS Runtime Monitoring to detect runtime threats from over 30 security findings to protect your EKS clusters. The new EKS Runtime Monitoring uses a fully managed EKS add-on that adds visibility into individual container runtime activities, such as file access, process execution, and network connections.
GuardDuty can now identify specific containers within your EKS clusters that are potentially compromised and detect attempts to escalate privileges from an individual container to the underlying Amazon EC2 host and the broader AWS environment. GuardDuty EKS Runtime Monitoring findings provide metadata context to identify potential threats and contain them before they escalate.
Configure EKS Runtime Monitoring in GuardDuty
To get started, first enable EKS Runtime Monitoring with just a few clicks in the GuardDuty console.

Once you enable EKS Runtime Monitoring, GuardDuty can start monitoring and analyzing the runtime-activity events for all the existing and new EKS clusters for your accounts. If you want GuardDuty to deploy and update the required EKS-managed add-on for all the existing and new EKS clusters in your account, choose Manage agent automatically. This will also create a VPC endpoint through which the security agent delivers the runtime events to GuardDuty.
If you configure EKS Audit Log Monitoring and runtime monitoring together, you can achieve optimal EKS protection both at the cluster control plane level, and down to the individual pod or container operating system level. When used together, threat detection will be more contextual to allow quick prioritization and response. For example, a runtime-based detection on a pod exhibiting suspicious behavior can be augmented by an audit log-based detection, indicating the pod was unusually launched with elevated privileges.
These options are default, but they are configurable, and you can uncheck one of the boxes in order to disable EKS Runtime Monitoring. When you disable EKS Runtime Monitoring, GuardDuty immediately stops monitoring and analyzing the runtime-activity events for all the existing EKS clusters. If you had configured automated agent management through GuardDuty, this action also removes the security agent that GuardDuty had deployed.
Manage GuardDuty Agent Manually
If you want to manually deploy and update the EKS managed add-on, including the GuardDuty agent, per cluster in your account, uncheck Manage agent automatically in the EKS protection configuration.
When managing the add-on manually, you are also responsible for creating the VPC endpoint through which the security agent delivers the runtime events to GuardDuty. In the VPC endpoint console, choose Create endpoint. In the step, choose Other endpoint services for Service category, enter com.amazonaws.us-east-1.guardduty-data for Service name in the US East (N. Virginia) Region, and choose Verify service.
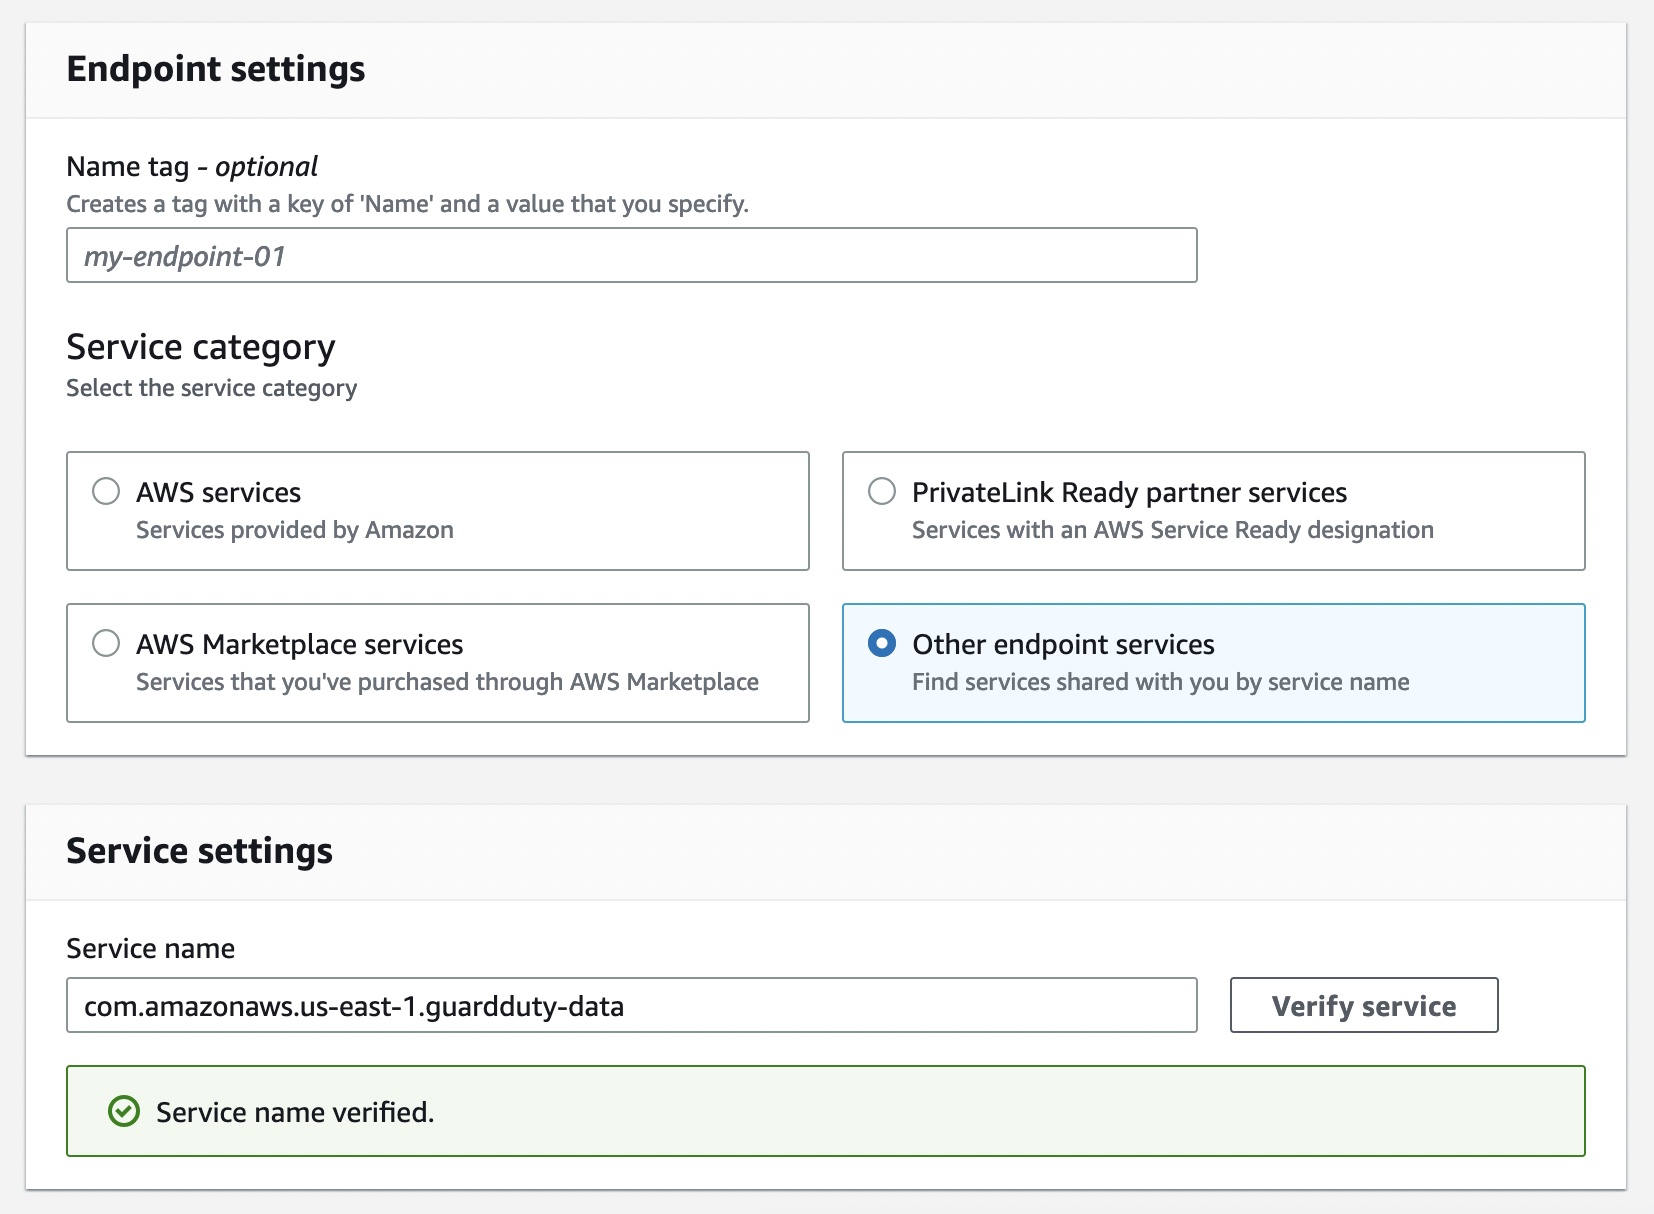
After the service name is successfully verified, choose VPC and subnets where your EKS cluster resides. Under Additional settings, choose Enable DNS name. Under Security groups, choose a security group that has the in-bound port 443 enabled from your VPC (or your EKS cluster).
Add the following policy to restrict VPC endpoint usage to the specified account only:
{
        "Version": "2012-10-17",
        "Statement": [
                {
                        "Action": "*",
                        "Resource": "*",
                        "Effect": "Allow",
                        "Principal": "*"
                },
                {
                        "Condition": {
                                "StringNotEquals": {
                                        "aws:PrincipalAccount": "123456789012"
                                }
                        },
                        "Action": "*",
                        "Resource": "*",
                        "Effect": "Deny",
                        "Principal": "*"
                }
        ]
}
Now, you can install the Amazon GuardDuty EKS Runtime Monitoring add-on for your EKS clusters. Select this add-on in the Add-ons tab in your EKS cluster profile on the Amazon EKS console.
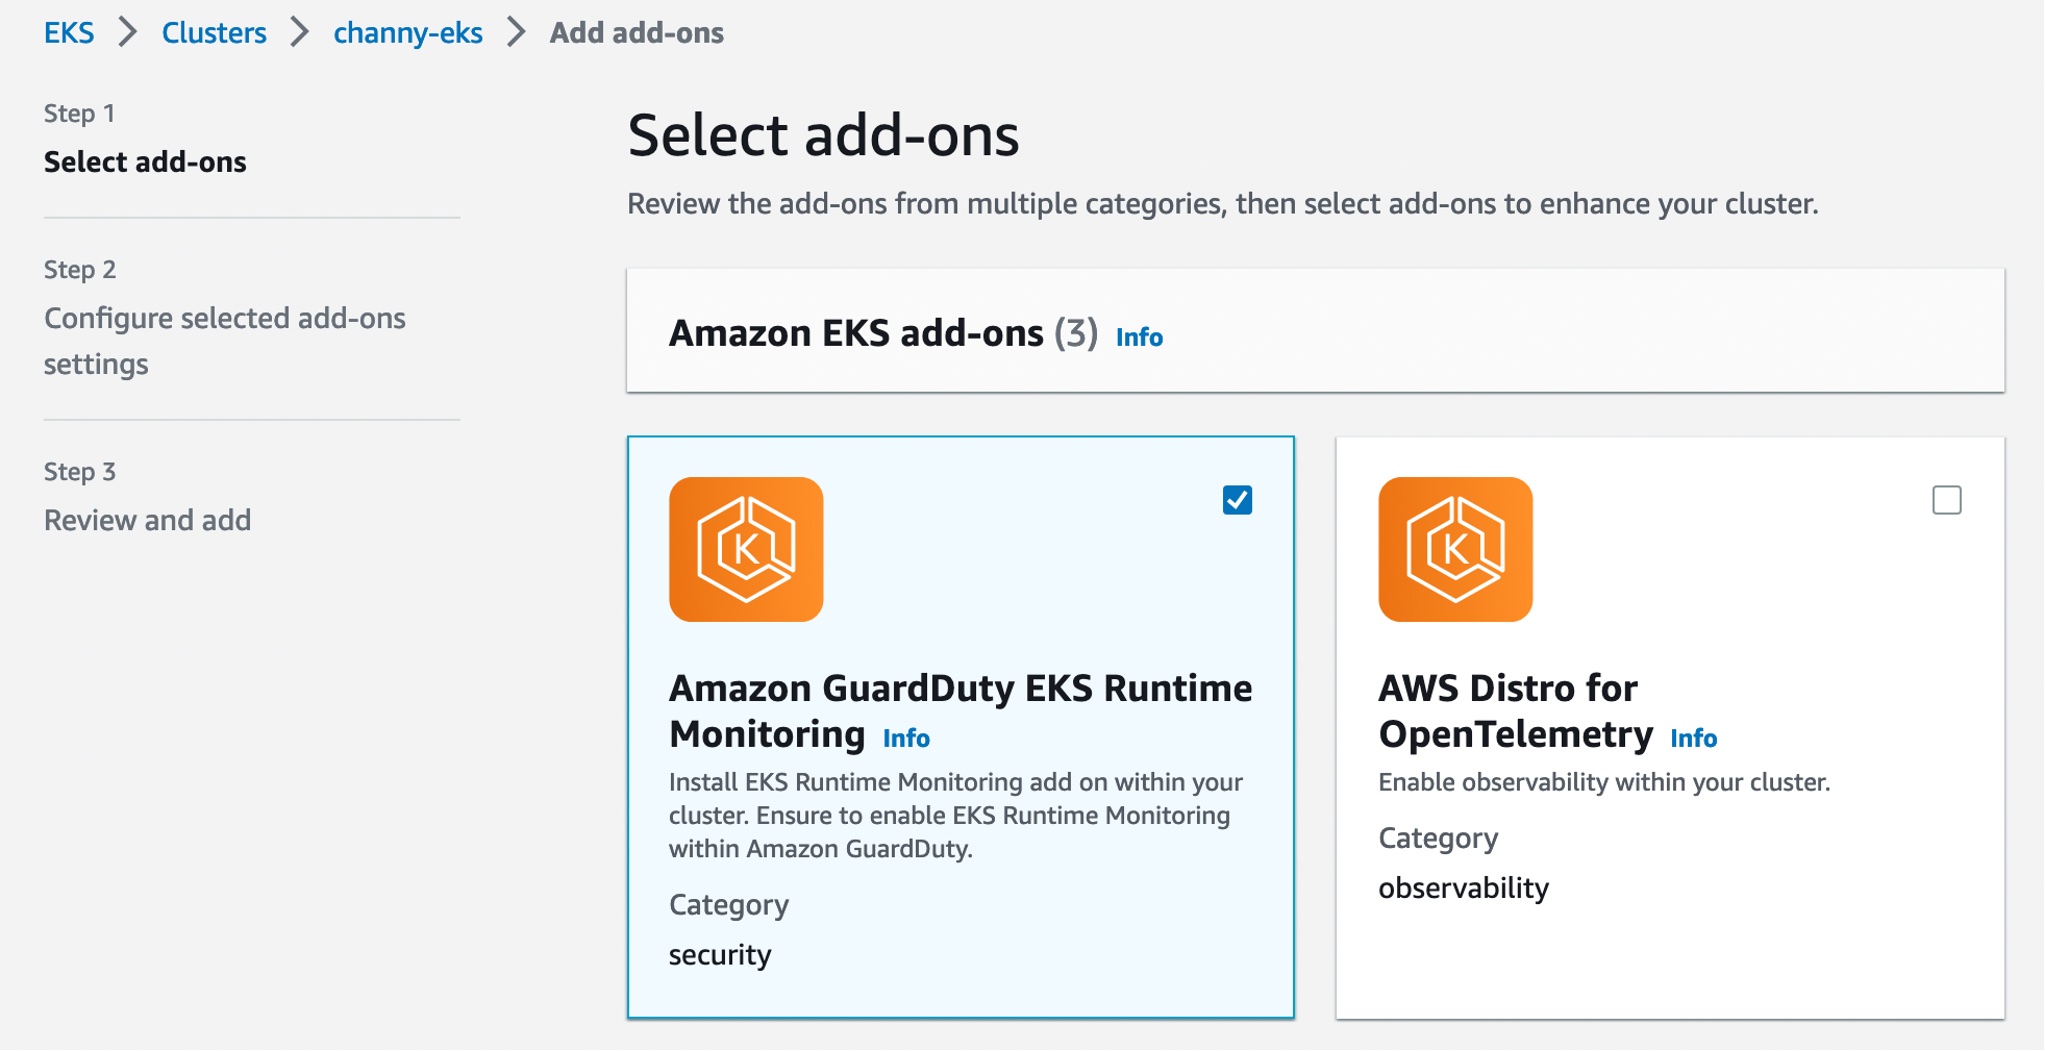
When you enable EKS Runtime Monitoring in GuardDuty and deploy the Amazon EKS add-on for your EKS cluster, you can view the new pods with the prefix amazon-guardduty-agent. GuardDuty now starts to consume runtime-activity events from all EC2 hosts and containers in the cluster. GuardDuty then analyzes these events for potential threats.

These pods collect various event types and send them to the GuardDuty backend for threat detection and analysis. When managing the add-on manually, you need to go through these steps for each EKS cluster that you want to monitor, including new EKS clusters. To learn more, see Managing GuardDuty agent manually in the AWS documentation.
Checkout EKS Runtime Security Findings
When GuardDuty detects a potential threat and generates a security finding, you can view the details of the corresponding findings. These security findings indicate either a compromised EC2 instance, container workload, an EKS cluster, or a set of compromised credentials in your AWS environment.
If you want to generate EKS Runtime Monitoring sample findings for testing purposes, see Generating sample findings in GuardDuty in the AWS documentation. Here is an example of potential security issues: a newly created or recently modified binary file in an EKS cluster has been executed.

The ResourceType for an EKS Protection finding type could be an Instance, EKSCluster, or Container. If the Resource type in the finding details is EKSCluster, it indicates that either a pod or a container inside an EKS cluster is potentially compromised. Depending on the potentially compromised resource type, the finding details may contain Kubernetes workload details, EKS cluster details, or instance details.

The Runtime details such as process details and any required context describe information about the observed process, and the runtime context describes any additional information about the potentially suspicious activity.

To remediate a compromised pod or container image, see Remediating Kubernetes security issues discovered by GuardDuty in the AWS documentation. This document describes the recommended remediation steps for each resource type. To learn more about security finding types, see GuardDuty EKS Runtime Monitoring finding types in the AWS documentation.
Now Available
You can now use Amazon GuardDuty for EKS Runtime Monitoring. For a full list of Regions where EKS Runtime Monitoring is available, visit region-specific feature availability.
The first 30 days of GuardDuty for EKS Runtime Monitoring are available at no additional charge for existing GuardDuty accounts. If you enabled GuardDuty for the first time, EKS Runtime Monitoring is not enabled by default, and needs to be enabled as described above. After the trial period ends in the GuardDuty, you can see the estimated cost of EKS Runtime Monitoring. To learn more, see the GuardDuty pricing page.
For more information, see the Amazon GuardDuty User Guide and send feedback to AWS re:Post for Amazon GuardDuty or through your usual AWS support contacts.
– Channy
from AWS News Blog https://ift.tt/apzbGQZ
via IFTTT
Wednesday, March 29, 2023
Monday, March 27, 2023
Announcing General Availability of Step-by-Step Guides for Amazon Connect Agent Workspace
At AWS re:Invent 2022 we announced the availability of step-by-step guides for Amazon Connect agent workspace in preview. My colleagues who collaborated to write the announcement post wrote about some of the challenges that contact centers face with training new agents to get up to speed with their agent desktop. They also mentioned that until agents become proficient, it takes them longer to address customer needs effectively, resulting in customer dissatisfaction.
Amazon Connect agent workspace was announced in 2021 and is a single, intuitive application that provides contact center agents with the tools that are required to onboard an agent quickly, resolve issues efficiently, and improve the customer experience. With Amazon Connect agent workspace, the agent is provided with all the tools on one screen. To think of the agent workspace, imagine the agent accepting a call, a chat, or a task and being given the necessary information about the customer and the case, plus real-time recommendations, all in one place without the need to switch between applications.
Step-by-step guides enable organizations to provide customizable experiences for their agents within the workspace, enabling them to deliver exceptional service from their first day on the job by surfacing relevant information and actions that the agent requires in order to resolve customer issues faster. This is because the step-by-step experience guides agents by identifying customer issues and then recommending subsequent actions, ensuring that the agent never has to guess or rely on past experience to know what comes next. This is helpful for both new and experienced agents. New agents can learn the system and get acquainted with their job and experienced agents can keep to the organization’s standard operating procedures instead of diverging in how they handle the same type of customer request.
Because of this intuitive experience, onboarding time for agents can be reduced by up to 50 percent, time to proficiency for the agent can be reduced by up to 40 percent, and contact handle time is reduced by up to 35 percent ultimately resulting in an improved and consistent customer experience.
A High-Level Overview of Step-by-Step Guides
During the announcement of step-by-step guides in preview, I was fascinated to learn that the experience was researched and developed in the context of Amazon Customer Service. However, step-by-step guides can also be generalized to apply to other types of organizations and use cases including the following:
- Retail – You can customize guides to suit your retail organization, for example, guides for returning a purchase by a customer.
- Financial Services – An example would be adding an authorized user to a credit card. Using guides, the agent can help the customer capture new user information and handle approvals through a single workflow that is consolidated within the guides.
- Hospitality – A great example here would be creating a new reservation at a hotel by consolidating all the processes involved into a single workflow.
- Embed as a Widget – With this, you can embed guides as a widget in your existing CRM or use APIs to bring guides to a custom workspace that you are already using in your organization.
The preview announcement post provides a deep dive into how to get started with step-by-step guides. It also shows how to deploy a sample guided experience and demonstrates how to customize guides to meet business needs. In this post we look at a high-level overview of what the agent, and the manager, can expect from step-by-step guides.
Agent experience
Step-by-step guides help with onboarding and ramping up of new agents and making them proficient faster by surfacing contextually relevant information and actions needed by agents. The intuitive experience of step-by-step guides provides agents with clear instructions of what they should be doing at any point in time when handling a particular customer case and supports agents in managing complex cases more accurately by automatically identifying issues.
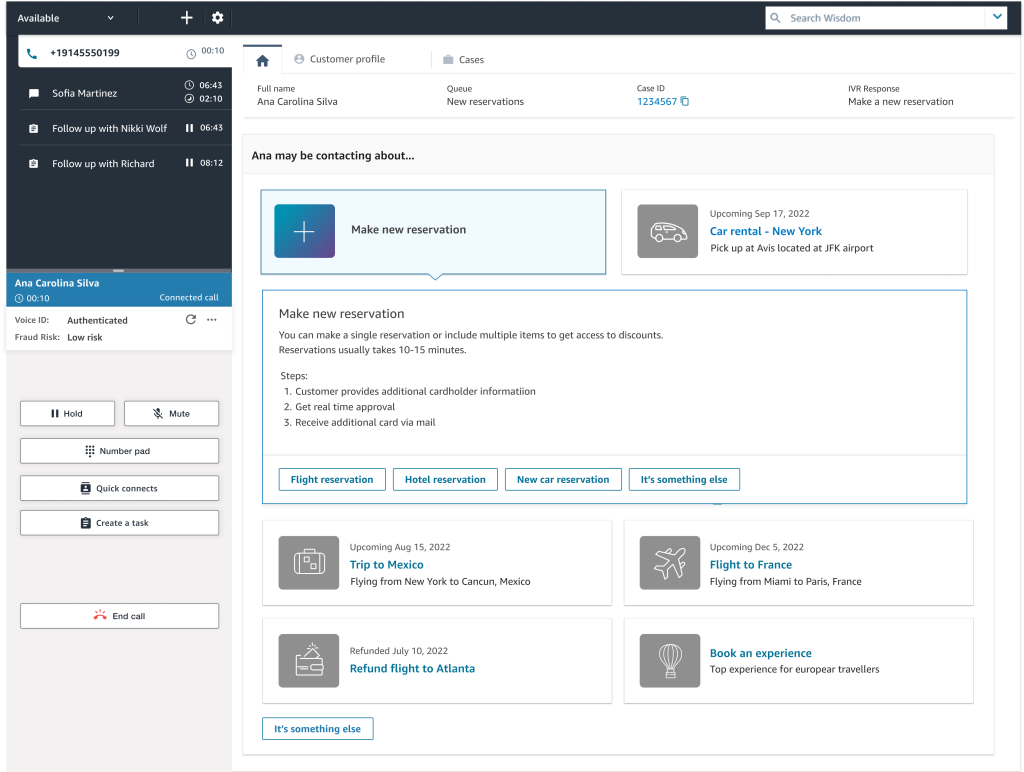
As an example, when a customer calls, the agent workspace automatically presents the agent with the likely issue based on the customer’s history or current context (for instance, making a flight reservation). Then, the step-by-step experience guides the agent through the actions needed to resolve the issue quickly (such as booking a hotel after the flight reservation has been completed).
The following screenshot provides a visual image of how this might look.
In the UI, the agent is provided with a sequence of simple UI pages to let them focus on one thing at a time, whether that’s an input field or a question to ask the customer. They can go step by step, getting the right information that they need to help the customer’s issue. Along the way, the agent receives scripting that they can read to the customer upon successful completion of the process.
The agent can always escape out of this workflow if it turns out that the workspace surfaced the wrong one, and they can find other workflows by searching for the correct one. This allows them to self-serve and find the right solution in case what was predicted by the step-by-step guides based on the context of the contact wasn’t perfectly aligned to what they needed.
Manager experience
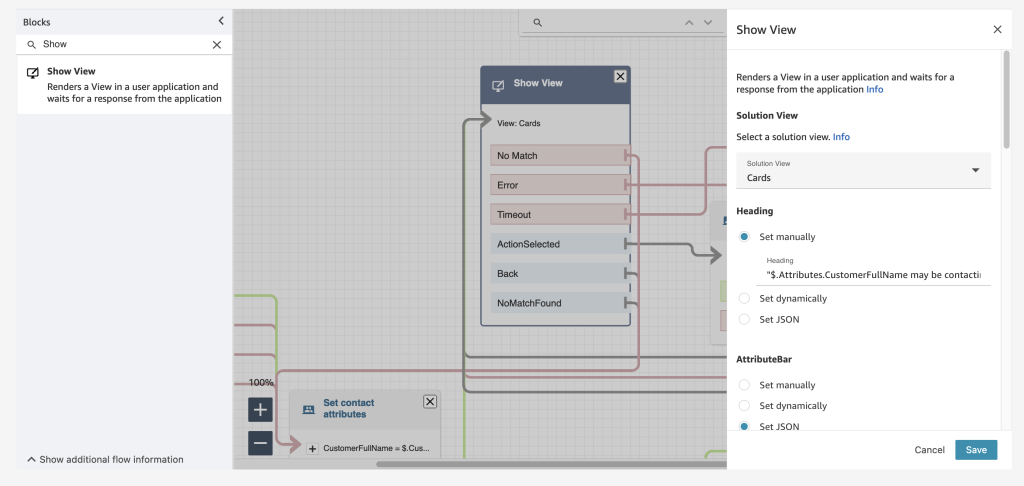
Amazon Connect already has a low-code, no-code builder known as Amazon Connect Flows. Flows provide a drag-and-drop experience for building IVRs, chatbots and routing logic for customers. To enable the same low-code, no-code configuration of step-by-step guides, managers are now provided with a new block within Flows known as the Show View block. The drag-and-drop experience of configuring step-by-step guides ensures that the manager no longer needs to have developers write code to build the custom workflows for the agent. Managers also no longer need to rely on static and difficult-to-follow instructions to use later to train agents.
Step-by-step guides are quickly created within the show view block with the help of five pre-configured views. Views are UI templates that can be used to customize the agent’s workspace, and each view is configurable. For example, you can use views to display contact attributes to an agent, provide forms for entering disposition codes, provide call notes, and present UI pages for walking agents through step-by-step guides.
The following example shows a view that we can use to create a guide for an agent that needs to book a round-trip flight for a customer. Booking this trip requires scheduling a flight to and from the destination, collecting traveler information, and asking about additional add-ons. With the form view, agents don’t have to recall all these specific steps; they can follow the wizard in their agent workspace. For each step, the agent is given form fields to fill in or options to choose from in order to quickly book the customer’s flight.
Step-by-step guides also help business operation teams figure out new ways to ensure that their agents are operating well and adjusting to new use cases. Step-by-step guides provide managers with insights into what agents do during a contact. During a workflow, data about what is shown to an agent, the decisions they made, the amount of time they spent on different steps, and what actions they took is captured and stored as a log record. Managers can use this data to improve their workflows and the agent and customer experiences.
Conclusion
In this post we discussed what step-by-step guides offer the agent and the manager of a contact center. Our customers are excited about how the guided experience consolidates actions into workflows and reduces the number of screens for their agents – at times from five screens down to one. In addition to all the benefits we’ve discussed in this post, guides provide you with opportunities to save between 15 – 20 percent on maintenance cost.
Now Available
Step-by-step guides are now generally available in all Regions where Amazon Connect is available, except AWS GovCloud (US-West) and Africa (Cape Town).
To learn more, refer to the Getting started with step-by-step guides for the Amazon Connect agent workspace post, and please send feedback to AWS re:Post for Amazon Connect or through your usual AWS support contacts.
– Veliswa x.
from AWS News Blog https://ift.tt/5AZdbCI
via IFTTT
How French Broadcaster TF1 Used AWS Cloud Technology and Expertise to Bring the FIFA World Cup to Millions
Three years before millions of viewers saw, arguably, one of the most thrilling World Cup Finals ever broadcast, TF1, the leading private TV channel in France, started a project to redefine the foundations of its broadcasting platform, including adopting a new cloud-based architecture.
They, and all other broadcasters, have been observing diminishing audiences for traditional over-the-air broadcasting and increasing popularity of digital platforms, such as smart TVs, and boxes like FireTV, ChromeCast, and AppleTV, as well as laptops, tablets, and mobile phones. According to Thierry Bonhomme, CTO of eTF1 (the group within TF1 in charge of digital platforms) whom I recently interviewed for the AWS French Podcast, digital broadcasting now accounts for 20–25 percent of TF1’s total audience.
 This online and mobile usage drives very specific traffic patterns on IT systems: a huge peak of connections and authentications in the few minutes before the start of a game and millions of video streams that must be delivered reliably over a variety of changing network qualities. In addition to these technical challenges, there is also an economic challenge: to deliver advertisements at key moments, such as before a national anthem or during a 15-minute half-time. The digital platform sells its own set of commercials, which are different from the commercials broadcast over the air, and might also be different from region to region. All these video streams have to be delivered to millions of viewers on a wide range of devices and a variety of network conditions: from 1 Gbs fiber at home down to 3 G networks in remote areas.
TF1’s approach to readiness included redesigning its digital architecture, setting up metrics showing how the new system is performing, and defining processes, roles and responsibilities for people in the team. As part of this preparation, AWS helped TF1 prepare their system to meet their scalability, performance, and security requirements.
In my conversation with Thierry, he described the two main objectives the company had when designing its new technical architecture for the future of broadcasting: first, the scalability of the platform and second, meet the demand for performance. Scalability is key to absorbing the peaks of concurrent viewers. And performance is required to ensure that the video streams start quickly (in less than 3 seconds) and there is no interruption of the video player (known as re-buffering). After all, nobody wants to know their team just scored by hearing their neighbors yelling before seeing it happen on the screen they’re watching.
The Technology
Starting in 2019, TF1 started to redesign its digital broadcasting architecture and to rewrite significant parts of the code, such as the back-end API or the front-end applications running on set-top boxes, on Android, or on iOS devices. They adopted a micro service architecture, deployed on Amazon Elastic Kubernetes Service (EKS) and written in the Go programming language for maximum performance. They designed a set of REST and GraphQL APIs to define the contracts between front and back-end applications, and an event-driven architecture with Apache Kafka for maximum scalability. They adopted multiple content delivery networks, including Amazon CloudFront, to reliably distribute the video streams to client devices. In August 2020, TF1 got a chance to test the new platform on a large-scale sporting event when Bayern Munich beat Paris Saint Germain 1-0 at the UEFA European Champion League.

Here’s a peek at what happens from the moment the action is shot on the field to the moment you see it on your mobile device: The high-quality video stream first lands in the TF1 tower, located in Paris, where hardware encoders create the necessary videos streams adapted to your device. AWS Elemental Live hardware encoders are able to generate up to eight different encodings: 4K for TVs, high-definition (1080), standard definition (720), and a variety of other formats suited to a wide range of mobile devices and network bandwidth. (This extra video encoding step is one of the reasons why you might sometimes observe a extra latency between the video you receive on your traditional TV and the feed you receive on your mobile device.) The system sends the encoded videos to AWS Elemental Media Package for packaging and, finally, to the CDNs where the player applications fetch the video segments. The player applications select the best video encoding depending on your device size and current network bandwidth available.
At the end of 2021, one year before millions watched French player Kylian Mbappé score a hat trick (three goals) for the first time in a World Cup final since 1966, TF1 started preparing for the big event by identifying risks based on previous experiences and areas needing improvement. Thierry described how they built hypotheses of the likely audience size based on different game scenarios: the longer the French national team might stay in the competition, the higher the expected traffic. They classified risks for each phase of the tournament (selection pools, quarter-final, semi-final, and final). Based on these scenarios, they figured that the platform must be able to sustain 4.5 million viewers connecting to the platform 15 minutes before the start of a game (that’s 5,000 new viewers every second).
This level of scalability requires preparation from TF1’s team but also all external systems in use, such as the AWS cloud services, the authentication and authorization service, and the CDN services.
A viewer arrival triggers multiple flows and API calls. The viewer must authenticate, and some must create a new account or reset their passwords. Once authenticated, the viewer sees the homepage that, in turn, triggers multiple API calls, one of them to the catalog service. When the viewer selects a live stream, other API calls are made to receive the video stream URL. Then the video part kicks in. The client-side player connects to the chosen CDN and starts to download video segments. Once the video is playing, the platform must ensure the stream is delivered smoothly, with high quality and no drop that would cause a re-buffering. All these elements are key to ensuring the best possible viewer experience.
The Preparation
Six months before France made it to the final and squared off against Argentina, TF1 started to work closely with their vendors, including AWS, to define requirements, reserve capacity, and start to work on test and execution plans. At this point, TF1 engaged with AWS Infrastructure Event Management, a dedicated program of the AWS enterprise support plan. Our experts offer architecture and guidance and operational support during the preparation and execution of planned events, such as shopping holidays, product launches, migrations – and in this case, the largest football (soccer) event in the world. For these events, AWS helps customers assess operational readiness, identify and mitigate risks, and execute confidently with AWS experts by their side.
Special care was given to test the scalability of the API. The TF1 team developped a load-testing engine to simulate users connecting to the platform, authenticating, selecting a program, and starting a video stream. To closely simulate real traffic, TF1 used another hyperscale cloud provider to send requests to their AWS infrastructure. The testing allowed them to define the correct metrics to observe in their dashboards and the correct values to generate alarms. Thierry said the first time the load simulator ran full speed, simulating 5,000 new connections per second, it crashed the entire back end.
But like any world class team, TF1 used this to their advantage. They took 2–3 weeks to tune the system. They eliminated redundant API calls from client applications and applied aggressive caching strategies. They learned how to scale their back-end platform in response to such traffic. They also learned to identify the value of key metrics under load. After a couple of back-end deployments and new releases for their Android and iOS apps, the system successfully passed the load test. It was a month before the start of the event. At that moment, TF1 decided to freeze all new developments or deployments until the first kickoff in Qatar, unless critical bugs were found.
Monitoring and Planning
The technological platform was only one piece of the project, Thierry told me. They also designed metric dashboards using Datadog and Grafana to monitor key performance indicators and detect anomalies during the event. Thierry noted that when observing average values, they often miss parts of the picture. For example, he said, observing a P95 percentile value instead of an average shows the experience for five percent of your users. When you have three million of them, five percent represents 150K customers, so it is important to know what their experience is. (Incidentally, this percentile technique is used routinely at Amazon and AWS across all service teams, and Amazon CloudWatch has built-in support to measure percentile values.)
TF1 also prepared for the worst, he said, including the specter of having three million people staring at a black screen during a game. TF1 involved community managers and social media owners early on, and they prepared press releases and social media messages for multiple scenarios. The team also planned to gather all key team members together in a “war room” during each game to reduce communication and reaction time if something needed immediate action. This team included the AWS technical account manager, their counterpart from the authentication service, and other CDN vendors. AWS also had on-call engineers from service teams and premium support team monitoring the health of our services and ready to react in case something went wrong.
The Attacks Weren’t Just on the Field
Three key moments at the start of the tournament provided opportunities to test the platform for real: the opening ceremony, the first game, and particularly for TF1’s audience, the first game for the French team. As the tournament played out over the following weeks — with increased intensity, suspense, and load on IT systems as the French team progressed — the TF1 team would reevaluate its traffic estimates and conduct debriefs after each game. But while the intensity of the action was unfolding on the field, TF1’s team had some behind-the-scenes excitement of its own.
Starting in the quarter final, the team noticed unusual activity from a wide range of distributed IP addresses, and they determined that the system was under a large distributed denial of service (DDOS) attack from a network of compromised machines; someone was trying to take down the service and prevent millions of people from watching. TF1 is accustomed to these types of attacks, and their dashboard helped to identify the traffic patterns in real time. Services such as AWS Shield and AWS Web Application Firewall helped to mitigate the incident without impacting the viewer experience. The TF1 security team and AWS experts conducted further analysis to proactively block some patterns of traffic and IP addresses for the next game.
Still, the intensity of the attacks increased during the semi-finals and final game, when it peaked at 40 millions of requests for a ten-minute period. “These attacks are a cat-and-mouse game,” said Thierry: attackers try new strategies and apply new patterns, but the team in the war room detects them and dynamically updates the filtering rules to block them before viewers can even detect a change in the quality of the service. The long and detailed preparation served its purpose, and everybody knew what to do. Thierry reported that the attacks were successfully mitigated with no consequences.
The Thrilling Finale
 By the time France took to the pitch on Dec. 18, 2022, TF1 knew they would break records on the platform. Thierry said the traffic was higher than estimated, but the platform absorbed it. He also described that during the first part of the game, when Argentina was leading, the TF1 team observed a slow decline of connections… that is, until the first goal scored by MBappé 10 minutes before the end of the game. At that point, all dashboards showed a sudden return of viewers for the thrilling last moments of the game. At peak, more than 3.2 million digital players were connected at the same time, delivering 3.6 terabits per second of outgoing bandwidth through all four CDNs.
Across the globe, Amazon CloudFront also helped 18 broadcasters deliver video streams. In all, over 48 million unique client IPs connected to one of 450+ edge locations globally during the tournament, peaking at just under 23 terabits per second across these customer distributions during the final game of the tournament.
The Future
While Argentina ultimately triumphed and Lionel Messi achieved his long-sought World Cup win, the 2022 FIFA World Cup proved to the team at TF1 that their processes, their architecture, and their implementation are able to deliver a high-quality viewing experience to millions. The team is now confident the platform is ready to absorb the next planned large-scale events: the World Cup of Rugby in September 2023 and the next French presidential election in 2027. Thierry concluded our conversation predicting digital broadcasting will eventually attain a larger audience than over-the-air, and having 3+ millions simultaneous viewers will become the new normal.
If your company is also looking to transform its business using the power of cloud computing, consult with one of our AWS Enterprise support advisors today.
-- sebfrom AWS News Blog https://ift.tt/z6Xf3M4
via IFTTT
Amazon Chime SDK Call Analytics: Real-Time Voice Tone Analysis and Speaker Search
Amazon Chime SDK Call Analytics: Real-Time Voice Tone Analysis and Speaker Search
Today, I am pleased to announce the availability of Amazon Chime SDK call analytics, a new set of capabilities that helps make it easier and cost effective to record and generate insights on real-time audio calls: transcription, voice tone analysis, and speaker search. We’ve also improved the Amazon Chime SDK section of the AWS Management Console to let you integrate machine learning (ML)-based services, such as these new call analytics capabilities or Amazon Transcribe into your audio applications in just a few steps.
Voice Analytics: Voice Tone Analysis and Speaker Search
Voice analytics delivers real-time insights into audio conversations. It helps detect and classify participants expressing a positive, neutral, or negative tone. Typically, enterprises working in regulated industries have obligations to record or want to analyze conversations between employees and their business partners, customers, or suppliers.
Voice tone analysis uses ML to extract sentiment from a speech signal based on a joint analysis of lexical and linguistic information as well as acoustic and tonal information. Voice tone analysis for live calls are delivered in the data lake of your choice, on top of which you can create your own dashboards to visualize the data.
Let’s take an example from the finance industry. Trading room supervisors are sometimes required to record all the trading conversations occurring on the floor. Voice tone analysis helps them meet their regulatory requirements. They can also deliver these insights to the traders to help to improve their productivity. But finance is not the only industry that needs to record and analyze calls. We have received similar requests from customers in Business Process Outsourcing (BPO), public sector, healthcare, telecom, and insurance industries.
Alongside with voice tone analysis, your applications can now benefit from speaker search to help match speakers to an existing database. It only requires a short sample to recognize a speaker based on their voice stored in a database of known voices. Speaker search helps your applications expedite caller lookup and enrich call records and transcripts with identity attribution. Speaker search delivers a suggested unique internal identifier for the speaker and a confidence score. The decision to match current the speaker with a known speaker from your organization is up to your application. Some of our customers plan to use speaker search for real-time speaker labeling on communication happening over trading turrets, which are shared devices.
Integration with AI Services in the AWS Management Console
We want to make it easier for developers to add these capabilities into existing telephony applications without requiring expertise in telephony, cloud infrastructure, or AI.
This is why we added a easier-to-use graphical configuration in the Amazon Chime SDK section of the console. On the console, you can choose the AWS AI service you want to use to analyze real-time audio data: voice analytics, Amazon Transcribe, or Amazon Transcribe Call Analytics. Whether you choose to use voice analytics or Amazon Transcribe to generate insights, you don’t have to write any integration code. We manage the integrations with AWS AI services and your voice-based or telephony applications. The console helps you define where you want to send the analytics data: an Amazon Kinesis stream or an Amazon Simple Storage Service (Amazon S3) bucket. Voice analytics can send real-time notifications to a function deployed on AWS Lambda, or an SQS queue or Amazon Simple Notification Service (Amazon SNS) topic.
To visualize insights, call analytics also delivers analyses to a data lake of your choice. You can then use Amazon QuickSight or Tableau to build dashboards and get insights from real-time media. These dashboards can be embedded in apps, wikis, and portals. Of course, we don’t leave you alone with your data. You can download prebuilt dashboards as AWS CloudFormation templates to deploy into your own AWS account. The link to download these templates is available on the console.
Finally, call analytics can generate real-time alerts by posting events to Amazon EventBridge. You can route these events to any destination of your choice, on your AWS account or supported third-party applications.
When using call analytics, you can reduce the initial project time to generate insights from real-time audio from months to days.
How It Works
I’d like to show you how it works.
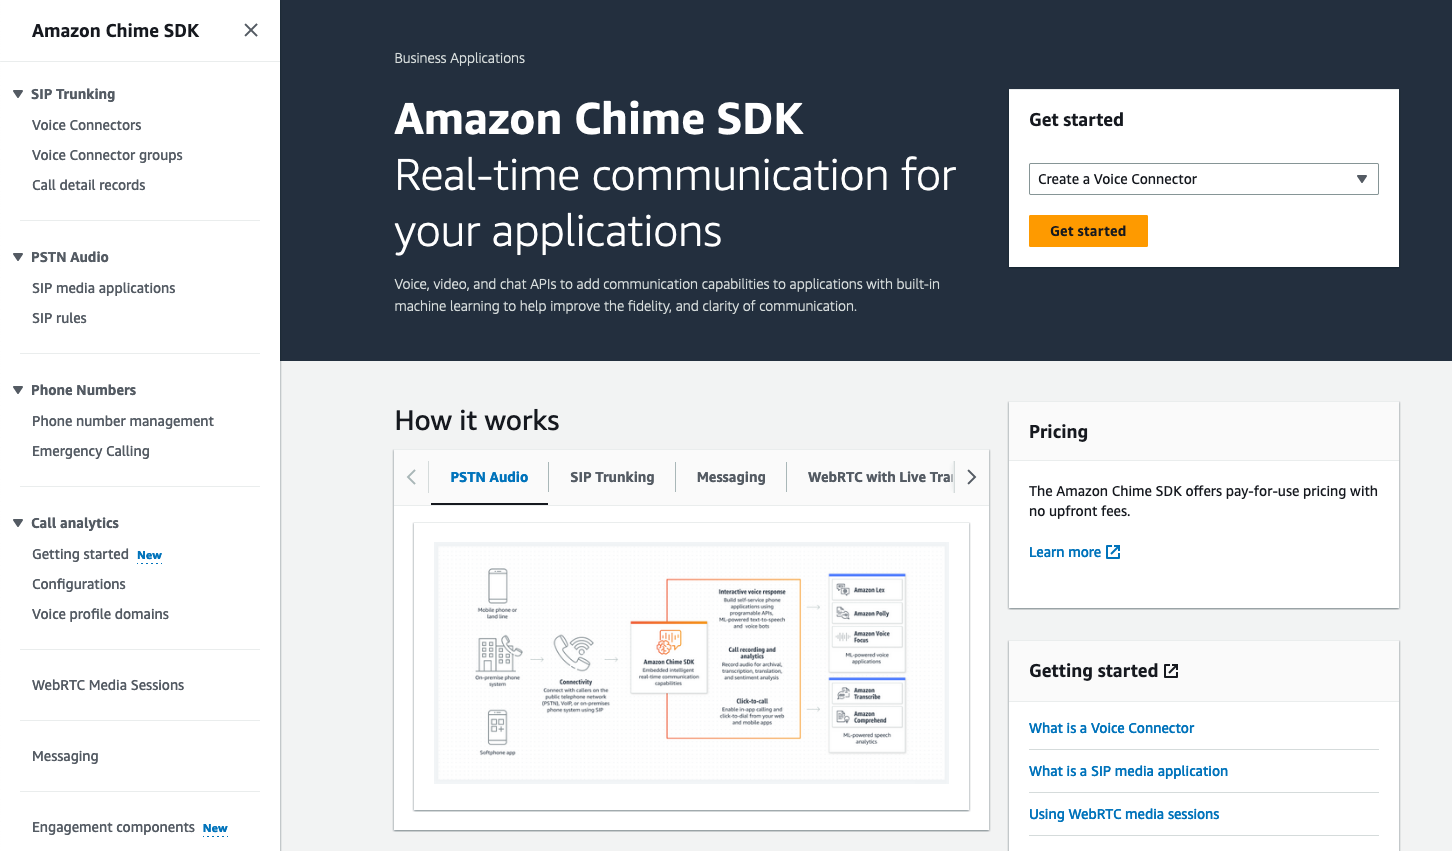
On the Amazon Chime SDK section of the console, I open Configuration under Call Analytics on the left-side menu. Then, I select Create configuration.
I give a name to my configuration. Optionally, I may also associate tags.
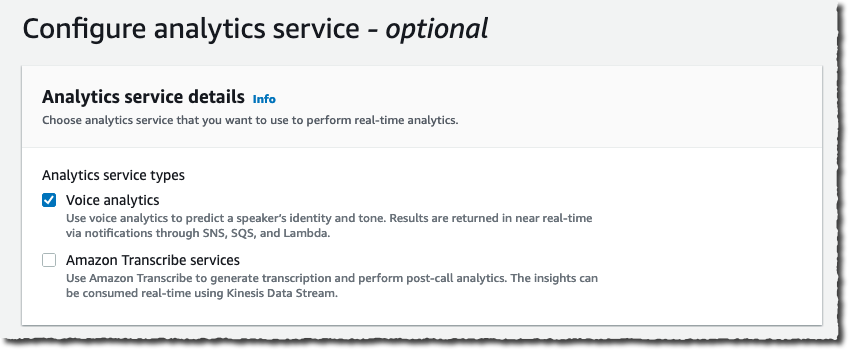
Under Configure analytics service, I can choose between Amazon Chime SDK voice analytics or Amazon Transcribe services to analyse calls. For this demo, I select Voice analytics.
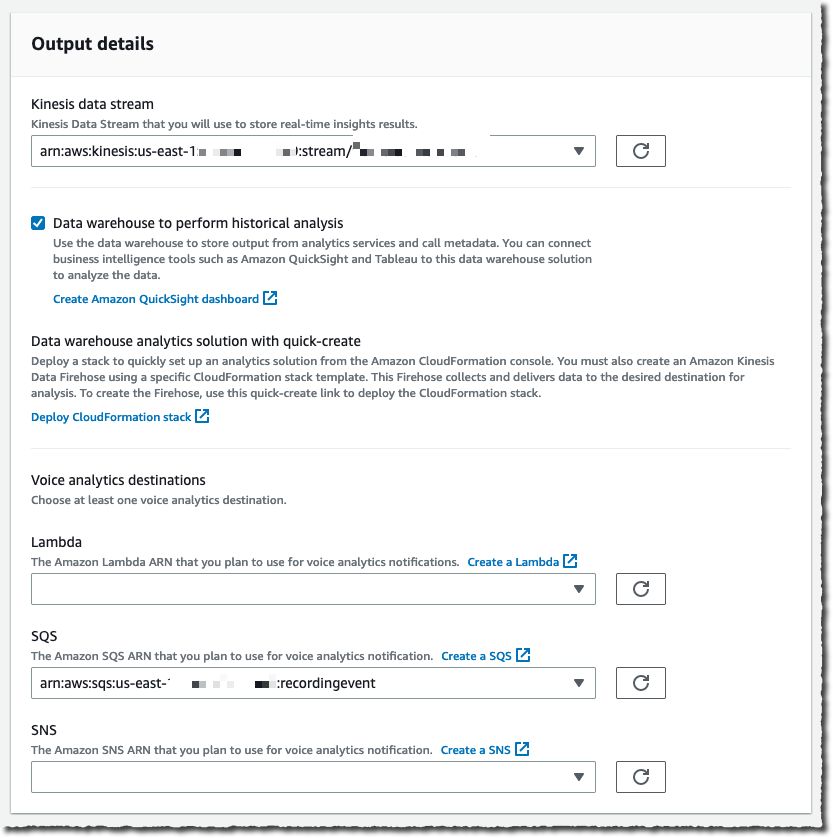
I configure where to send the analysis. Voice analytics results are always sent to Kinesis. I specify a Kinesis data stream I created previously. When I want to use a business intelligence tool such as Quicksight to create a dashboard with analytics results, I also specify an S3 bucket to receive the analysis.
The console also gives me the link to the CloudFormation templates I can use to create the voice analytics dashboards.
Finally, I choose a Lambda function, SQS queue, or SNS topic that will receive notifications of events such as when the analytics are available, a new voice enrollment occurs, or the result of a voice verification. In the later case, the payload looks as follow:
{
    ...common to all events...
    "detail-type": "SpeakerSearchStatus",
    "detail": {
        "taskId": "uuid",
        "detailStatus": "IdentificationSuccessful",
        "speakerSearchDetails" : {
            "results": [
                {
                    "voiceProfileId": "guid",
                    "confidenceScore": "0.94",
                },
                {
                    "voiceProfileId": "guid",
                    "confidenceScore": "0.92",
                },
                {
                    "voiceProfileId": "guid",
                    "confidenceScore": "0.91",
                },
                ... (up to 10)
            ]
        },
        "isCaller": false,
        "voiceConnectorId": "guid",
        "transactionId": "guid"

        ...details from Voice connector
    }
}
For this demo, I choose an existing SQS queue.
Under Consent acknowledgment, I select all the boxes and select Next.
The next step is only available when I didn’t specify any analytics service in the previous step. It allows us to configure voice recordings. Recordings are available when no analytics are selected.
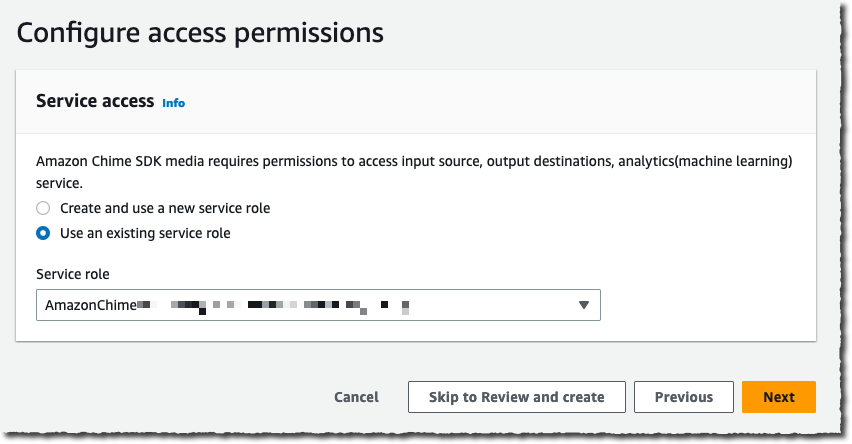
Under Configure access permissions, I choose a previously created AWS Identity and Access Management (IAM) role allowing the Amazon Chime SDK to access the other AWS services I configured: the Kinesis data stream, S3 bucket, and Lambda function, SQS queue, or SNS topic. The console may create an IAM role for me if I don’t have one already.
The next step is available if I selected Amazon Transcribe service under Configure analytics service. It allows me to configure real-time alerts through EventBridge. I may configure rules to send messages based on keyword match, sentiment detected, or issue detection.
The final step is Review and Create my configuration. I review the configuration details and then, I select Create configuration.
Finally, I link this configuration to a voice connector under the Voice Connector section, on the Streaming tab.
That’s it! As I mentioned earlier, no glue between AWS services or AI knowledge is required.
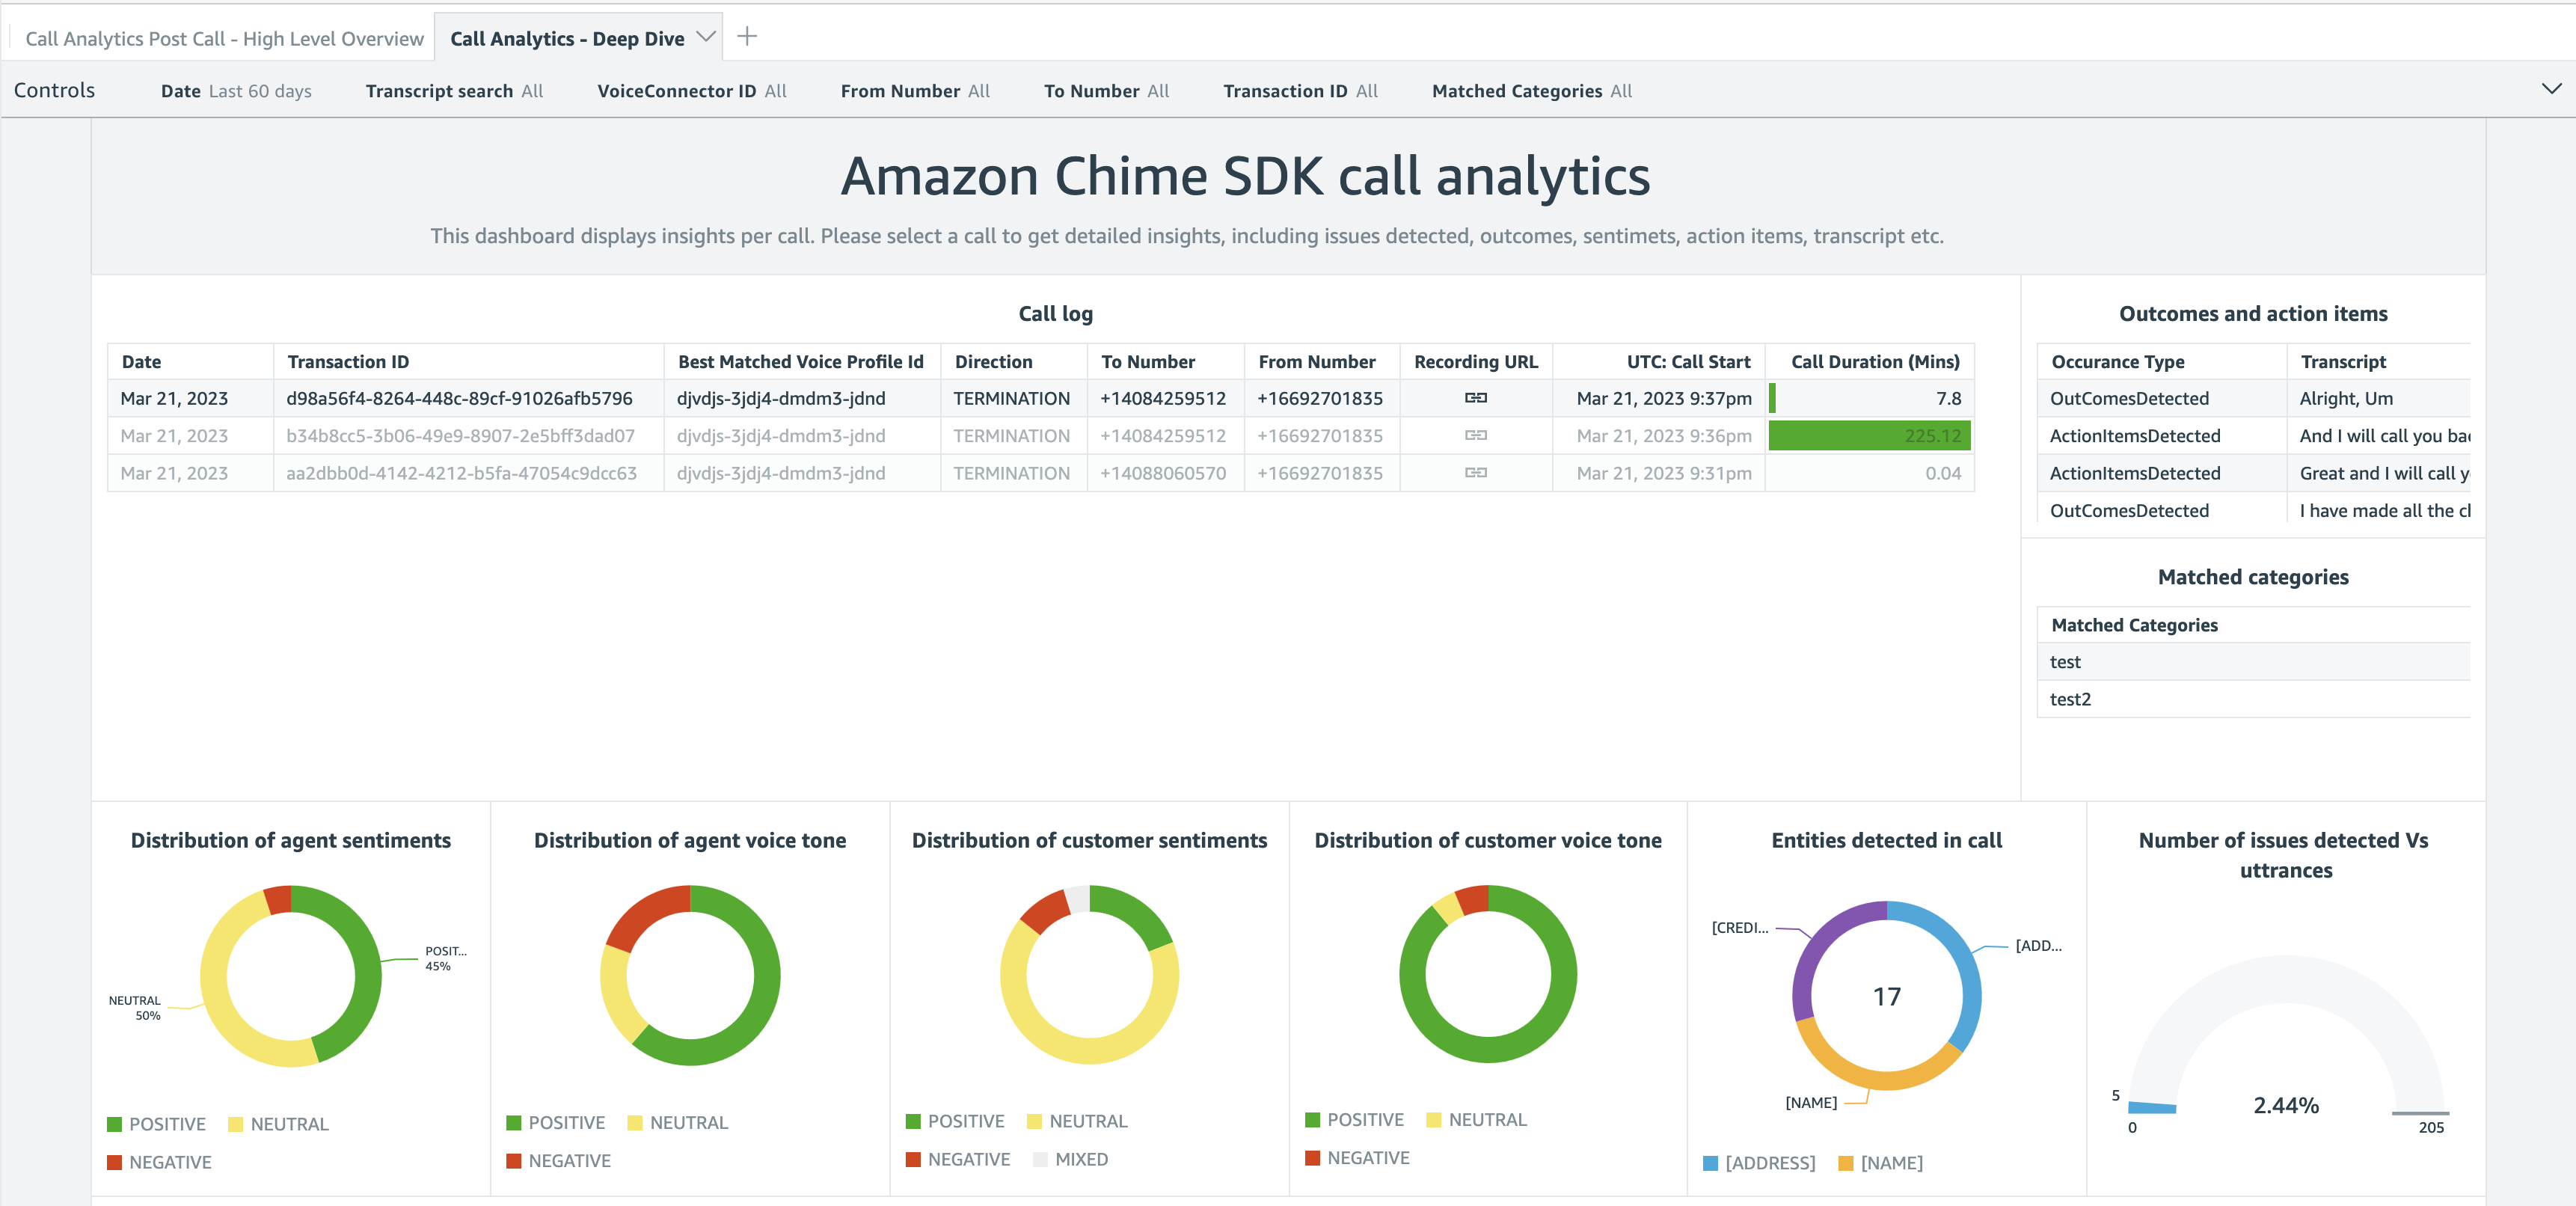
After the data arrives on Kinesis or your S3 bucket, you can point your preferred business reporting solution at it. When you use the QuickSight template we provide, you can get started in minutes with a high-level overview and a deep-dive view, as shown on the following screenshot.
The deep-dive dashboard gives you graphical representations about the distribution of agent and customer sentiments and emotions. You also get a detailed analysis and transcript of the conversation.
Pricing and Availability
Adopting these capabilities in your audio applications requires no up-front infrastructure investment; you will be charged based only on your usage. Pricing is per minute of audio data analyzed. Visit Amazon Chime SDK pricing for details.
Call analytics is available in the following AWS Regions: US East (N. Virginia), US West (Oregon), and Europe (Frankfurt).
In this post, I discussed Amazon Chime SDK call analytics, a new set of capabilities that makes it easier and cost-effective to record and generate insights on real-time audio calls. With their focus on ease of use, these new capabilities are particularly well adapted to customers with minimal knowledge of cloud infrastructure, telephony, and ML.
Start today and configure your first dashboard!
-- sebfrom AWS News Blog https://ift.tt/smRAzKj
via IFTTT
AWS Week in Review – March 27, 2023
In Finland, where I live, spring has arrived. The snow has melted, and the trees have grown their first buds. But I don’t get my hopes high, as usually around Easter we have what is called takatalvi. Takatalvi is a Finnish world that means that the winter returns unexpectedly in the spring.
Last Week’s Launches
Here are some launches that got my attention during the previous week.
AWS SAM CLI – Now the sam sync command will compare your local Serverless Application Model (AWS SAM) template with your deployed AWS CloudFormation template and skip the deployment if there are no changes. For more information, check the latest version of the AWS SAM CLI.
IAM – AWS Identity and Access Management (IAM) has launched two new global condition context keys. With these new condition keys, you can write service control policies (SCPs) or IAM policies that restrict the VPCs and private IP addresses from which your Amazon Elastic Compute Cloud (Amazon EC2) instance credentials can be used, without hard-coding VPC IDs or IP addresses in the policy. To learn more about this launch and how to get started, see How to use policies to restrict where EC2 instance credentials can be used from.
Amazon SNS – Amazon Simple Notification Service (Amazon SNS) now supports setting context-type request headers for HTTP/S notifications, such as application/json, application/xml, or text/plain. With this new feature, applications can receive their notifications in a more predictable format.
AWS Batch – AWS Batch now allows you to configure ephemeral storage up to 200GiB on AWS Fargate type jobs. With this launch, you no longer need to limit the size of your data sets or the size of the Docker images to run machine learning inference.
Application Load Balancer – Application Load Balancer (ALB) now supports Transport Layer Security (TLS) protocol version 1.3, enabling you to optimize the performance of your application while keeping it secure. TLS 1.3 on ALB works by offloading encryption and decryption of TLS traffic from your application server to the load balancer.
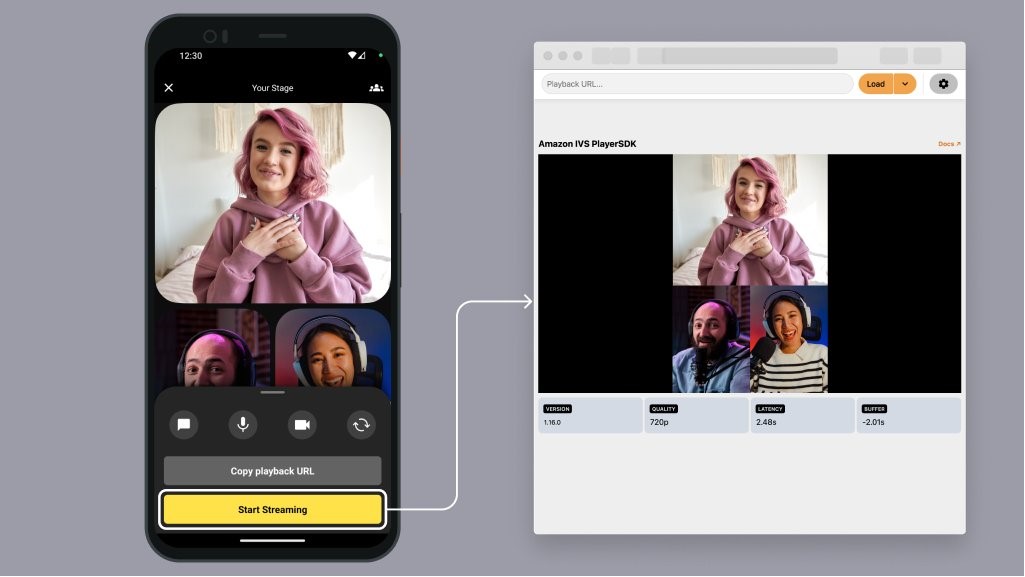
Amazon IVS – Amazon Interactive Video Service (IVS) now supports combining videos from multiple hosts into the source of a live stream. For a demo, refer to Add multiple hosts to live streams with Amazon IVS.
For a full list of AWS announcements, be sure to keep an eye on the What's New at AWS page.Other AWS News
Some other updates and news that you may have missed:
I read the post Implementing an event-driven serverless story generation application with ChatGPT and DALL-E a few days ago, and since then I have been reading my child a lot of AI-generated stories. In this post, David Boyne, explains step by step how you can create an event-driven serverless story generation application. This application produces a brand-new story every day at bedtime with images, which can be played in audio format.
Podcast Charlas Técnicas de AWS – If you understand Spanish, this podcast is for you. Podcast Charlas Técnicas is one of the official AWS podcasts in Spanish, and every other week there is a new episode. The podcast is meant for builders, and it shares stories about how customers have implemented and learned AWS services, how to architect applications, and how to use new services. You can listen to all the episodes directly from your favorite podcast app or at AWS Podcasts en español.
AWS open-source news and updates – The open source newsletter is curated by my colleague Ricardo Sueiras to bring you the latest open-source projects, posts, events, and more.
Upcoming AWS Events
Check your calendars and sign up for the AWS Summit closest to your city. AWS Summits are free events that bring the local community together, where you can learn about different AWS services.
Here are the ones coming up in the next months:
- March 28 – AWS Public Sector Symposium Brussels
- April 4 – AWS Summit Paris
- April 4 – AWS Summit Sydney
- May 4 – AWS Summit ASEAN, in Singapore
- May 4 – AWS Summit Berlin
- May 11 – AWS Summit Stockholm
- May 23 – AWS Summit Hong Kong
- June 1 – AWS Summit Amsterdam
- June 7 – AWS Summit London
- June 15 – AWS Summit Madrid
- June 22 – AWS Summit Milano
That’s all for this week. Check back next Monday for another Week in Review!
— Marcia
from AWS News Blog https://ift.tt/XqZfeAz
via IFTTT
