Monday, April 3, 2023

AWS Supply Chain Now Generally Available – Mitigate Risks and Lower Costs with Increased Visibility and Actionable Insights

Like many of you, I experienced the disrupting effects introduced by external forces such as weather, geopolitical instability, and the COVID-19 pandemic. To improve supply chain resilience, organizations need visibility across their supply chain so that they can quickly find and respond to risks. This is increasingly complex as their customers’ preferences are rapidly changing, and historical demand assumptions are not valid anymore.

To add to that, supply chain data is often spread out across disconnected systems, and existing tools lack the elastic processing power and specialized machine learning (ML) models needed to create meaningful insights. Without real-time insights, organizations cannot detect variations in demand patterns, unexpected trends, or supply disruptions. And failing to react quickly can impact their customers and operational costs.

Today, I am happy to share that AWS Supply Chain is generally available. AWS Supply Chain is a cloud application that mitigates risk and lowers costs with unified data, ML-powered actionable insights, and built-in contextual collaboration. Let’s see how it can help your organization before taking a look at how you can use it.

How AWS Supply Chain Works
AWS Supply Chain connects to your existing enterprise resource planning (ERP) and supply chain management systems. When those connections are in place, you can benefit from the following capabilities:

  • A data lake is set up using ML models that have been pre-trained for supply chains to understand, extract, and transform data from different sources into a unified data model. The data lake can ingest data from a variety of data sources, including your existing ERP systems (such as SAP S4/HANA) and supply chain management systems.
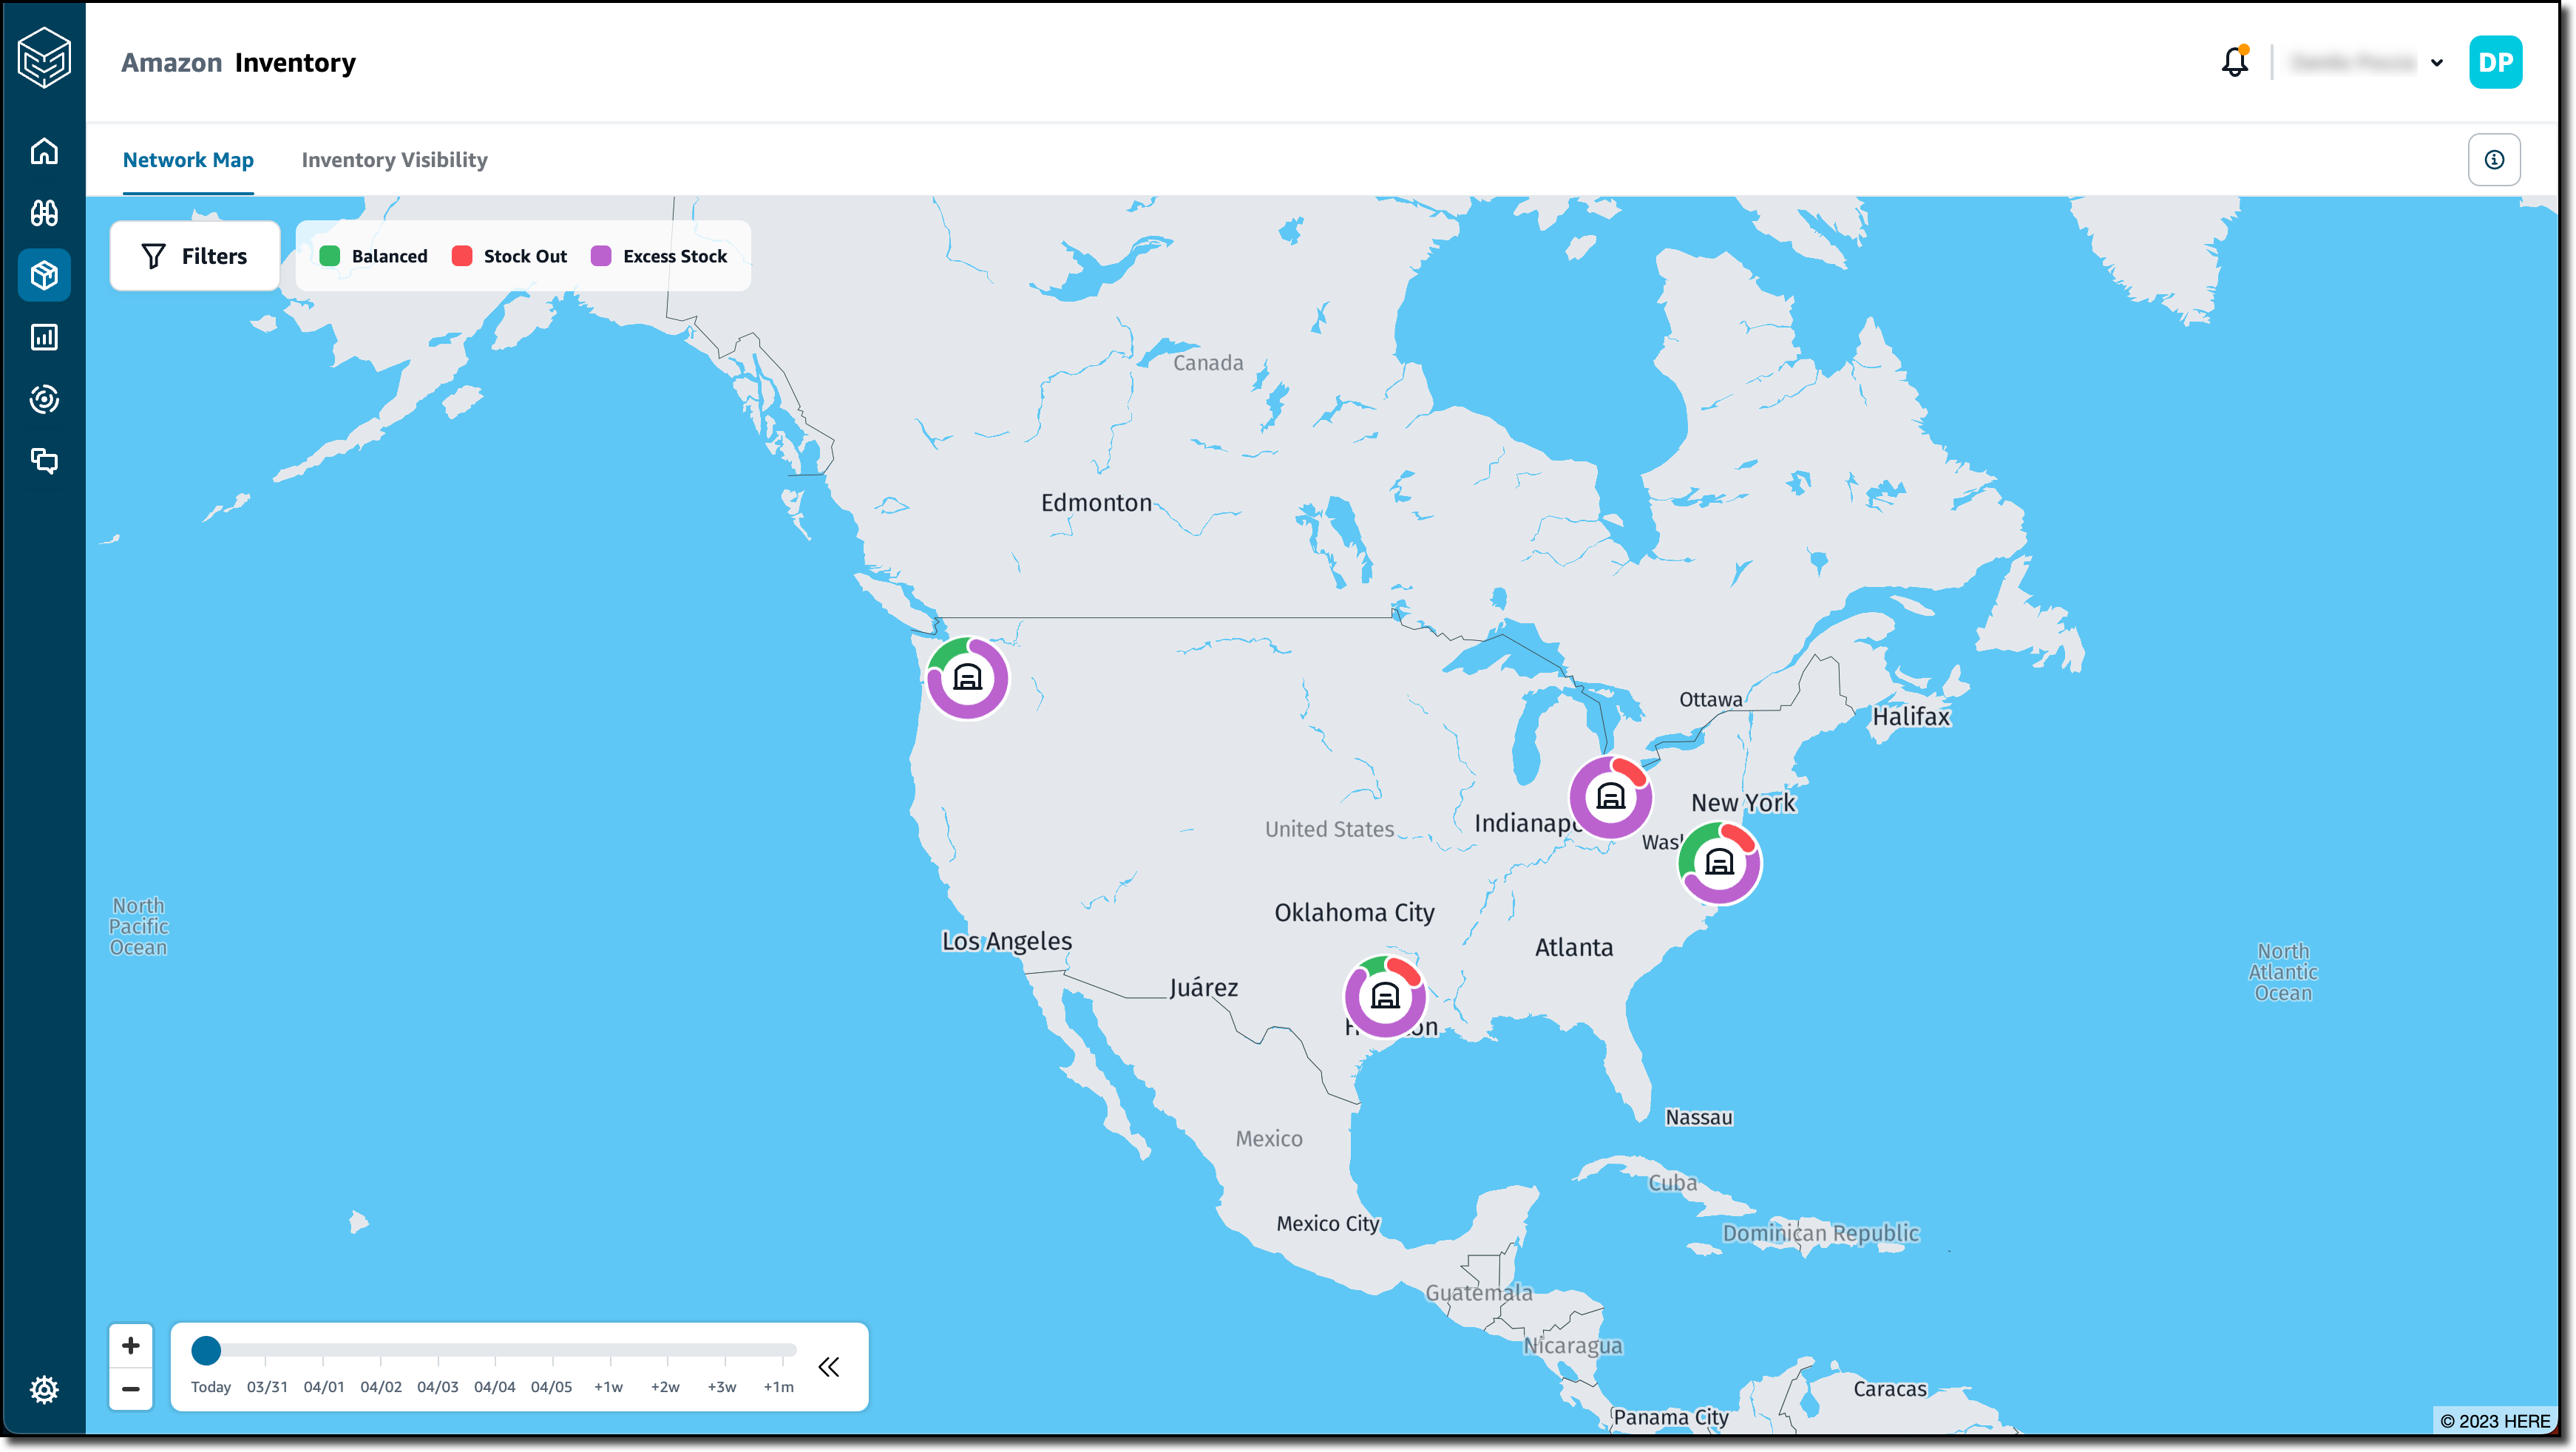
  • Your data is represented in a real-time visual map using a set of interactive visual end-user interfaces built on a micro front-end architecture. This map highlights current inventory selection, quantity, and health at each location (for example, inventory that is at risk for stock out). Inventory managers can drill down into specific facilities and view the current inventory on hand, in transit, and potentially at risk in each location.
  • Actionable insights are automatically generated for potential supply chain risks (for example, overstock or stock outs) using the comprehensive supply chain data in the data lake and are shown in the real-time visual map. ML models, built on similar technology that Amazon uses, are used to generate more accurate vendor lead time predictions. Supply planners can use these predicted vendor lead times to update static assumptions built into planning models to reduce stock out or excess inventory risks.
  • Rebalancing options are automatically evaluated, ranked, and shared to provide inventory managers and planners with recommended actions to take if a risk is detected. Recommendation options are scored by the percentage of risk resolved, the distance between facilities, and the sustainability impact. Supply chain managers can also drill down to review the impact each option will have on other distribution centers across the network. Recommendations continuously improve by learning from the decisions you make.
  • To help you work with remote colleagues and implement rebalancing actions, contextual built-in collaboration capabilities are provided. When teams chat and message each other, the information about the risk and recommended options is shared, reducing errors and delays caused by poor communication so you can resolve issues faster.
  • To help remove the manual effort and guesswork around demand planning, ML is used to analyze historical sales data and real-time data (for example, open orders), create forecasts, and continually adjust models to improve accuracy. Demand planning also continuously learns from changing demand patterns and user inputs to offer near real-time forecast updates, allowing organizations to proactively adjust supply chain operations.

Now, let’s see how this works in practice.

Using AWS Supply Chain To Reduce Inventory Risks
The AWS Supply Chain team was kind enough to share an environment connected to an ERP system. When I log in, I choose Inventory and the Network Map from the navigation pane. Here, I have a general overview of the inventory status of the distribution centers (DCs). Using the timeline slider, I am able to fast forward in time and see how the inventory risks change over time. This allows me to predict future risks, not just the current ones.
Console screenshot.

I choose the Seattle DC to have more information on that location.

Console screenshot.

Instead of looking at each distribution center, I create an insight watchlist that is analyzed by AWS Supply Chain. I choose Insights from the navigation pane and then Inventory Risk to track stock out and inventory excess risks. I enter a name (Shortages) for the insight watchlist and select all locations and products.

Console screenshot.

In the Tracking parameters, I choose to only track Stock Out Risk. I want to be warned if the inventory level is 10 percent below the minimum inventory target and set my time horizon to two weeks. I save to complete the creation of the insight watchlist.

Console screenshot.

I choose New Insight Watchlist to create another one. This time, I select the Lead time Deviation insight type. I enter a name (Lead time) for the insight watchlist and, again, all locations and products. This time, I choose to be notified when there is a deviation in the lead time that is 20 percent or more than the planned lead times. I choose to consider one year of historical time.

Console screenshot.

After a few minutes, I see that new insights are available. In the Insights page, I select Shortages from the dropdown. On the left, I have a series of stacks of insights grouped by week. I expand the first stack and drag one of the insights to put it In Review.

Console screenshot.

I choose View Details to see the status and the recommendations for this out-of-stock risk for a specific product and location.
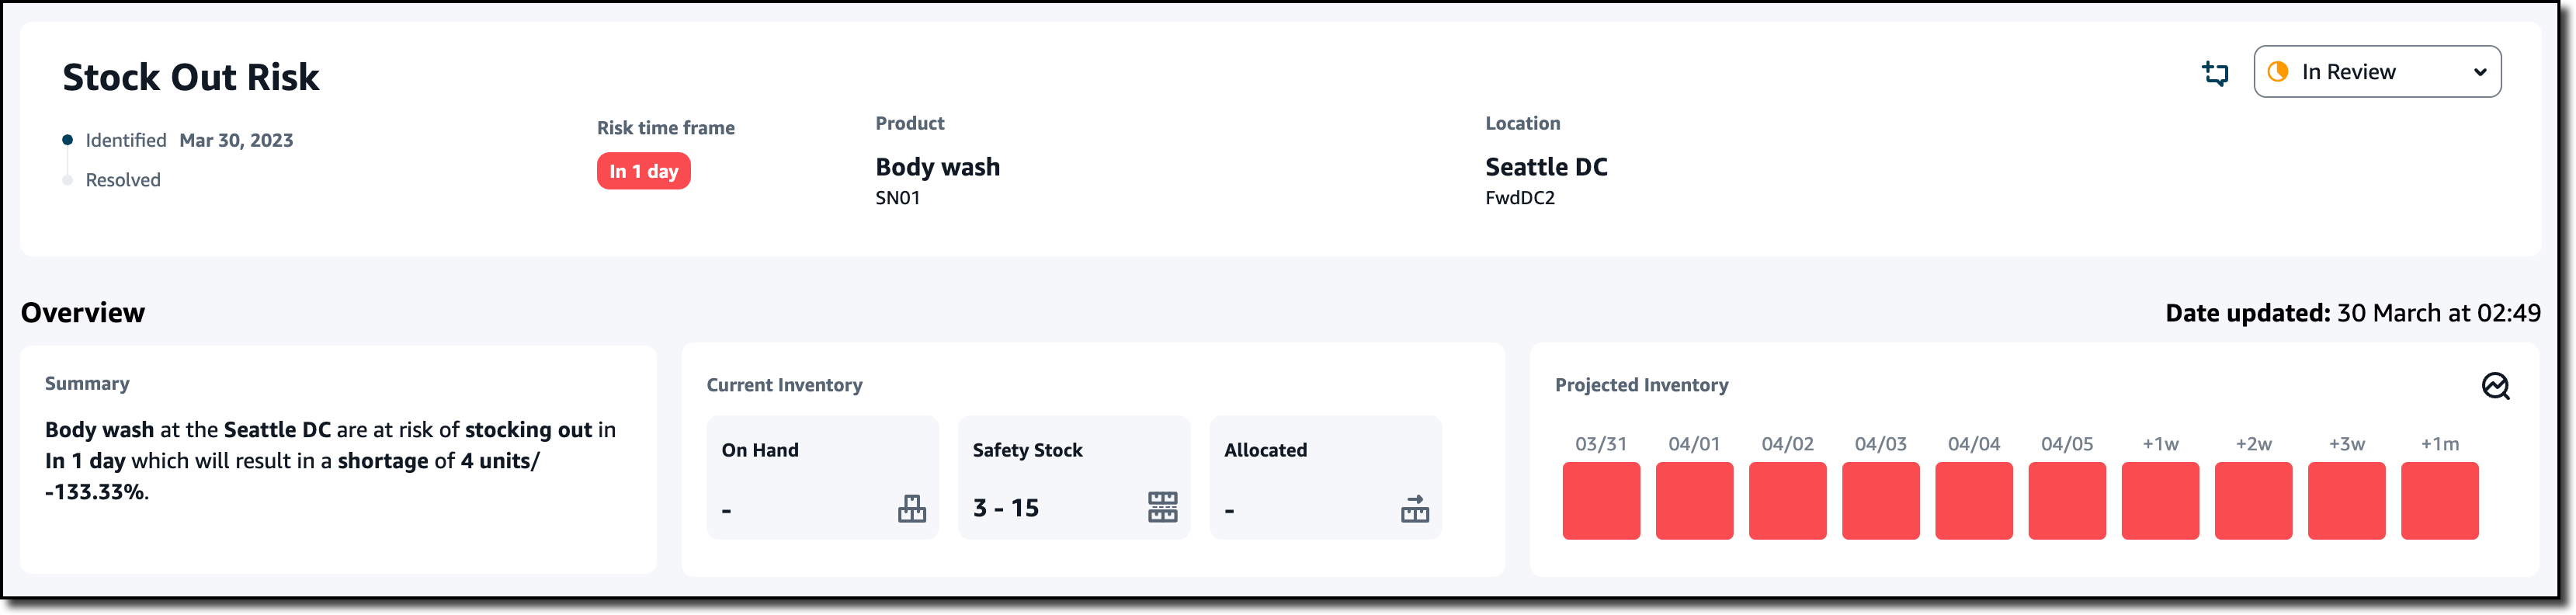
Console screenshot.

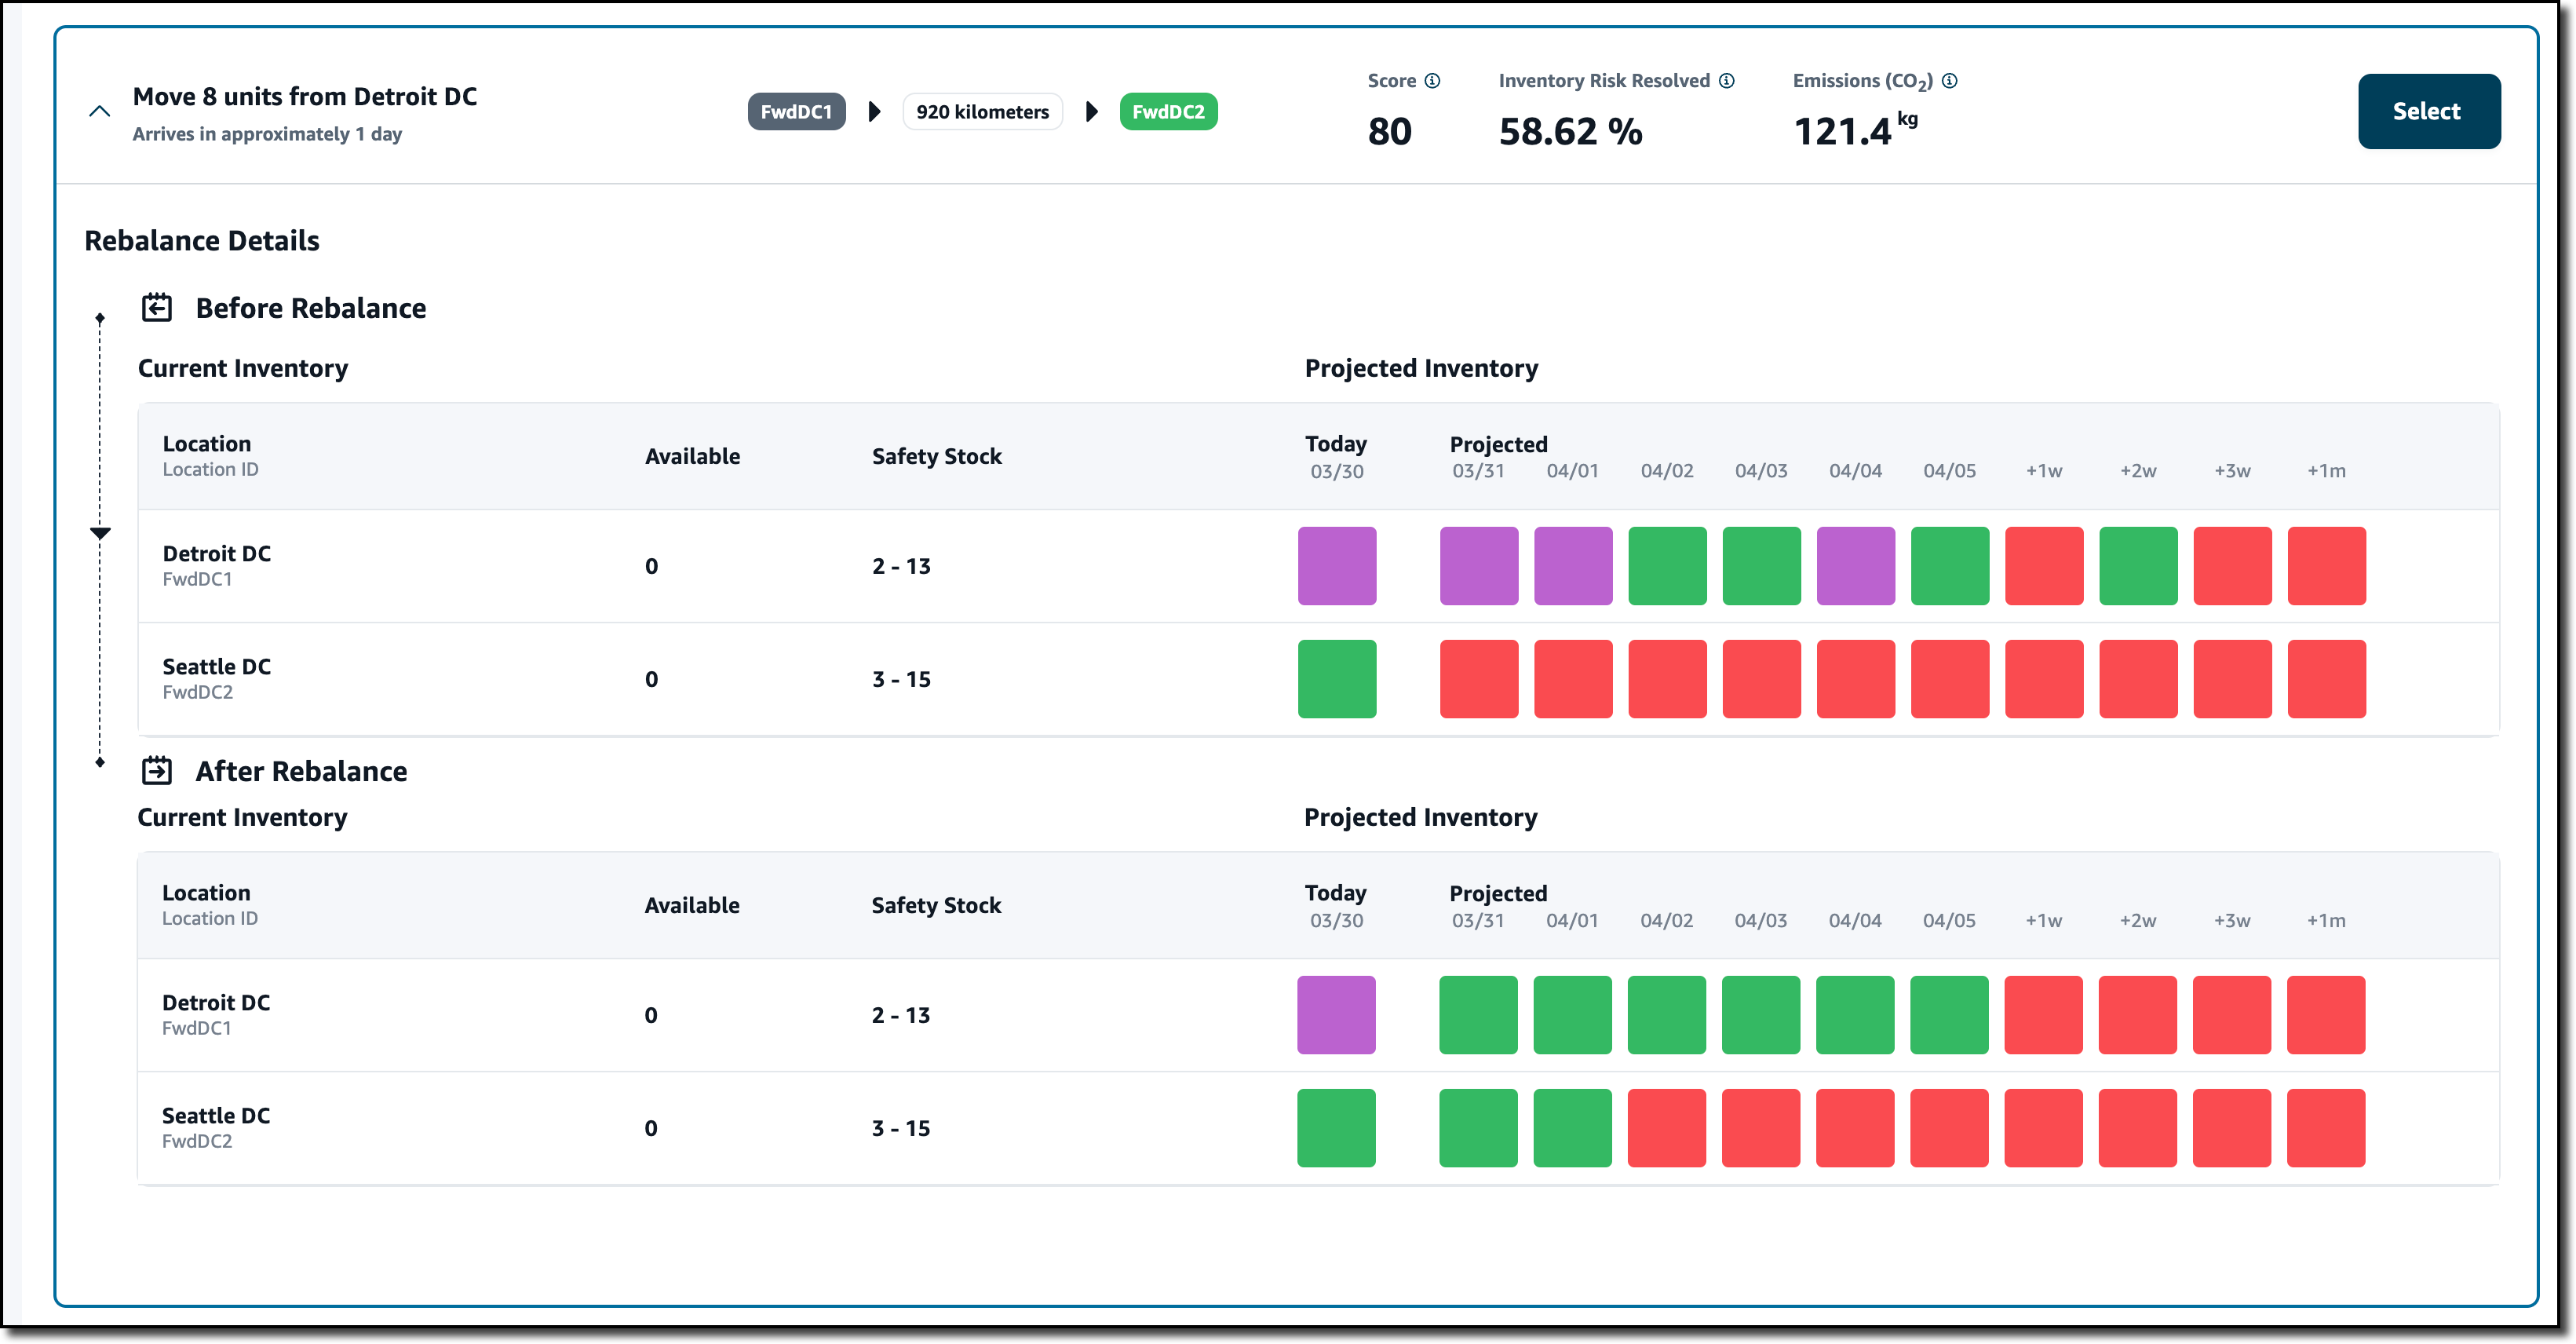
Just after the Overview, a list of Resolution Recommendations is sorted by a Score. Score weights are used to rank recommendations by setting the relative importance of distance, emissions (CO2), and percentage of the risk resolved. In the settings, I can also configure a max distance to be considered when proposing recommendations. The first recommendation is the best based on how I configure the score.
Console screenshot.

The recommendation shows the effect of the rebalance. If I move eight units of this product from the Detroit DC to the Seattle DC, the projected inventory is now balanced (color green) for the next two days in the After Rebalance section instead of being out of stock (red) as in the Before Rebalance section. This also solves the excess stock risk (purple) in the Detroit DC. At the top of the recommendation, I see the probability that this rebalance resolves the inventory risk and the impact on emissions (CO2).

I choose Select to proceed with this recommendation. In the dialog, I enter a comment and choose to message the team to start using the collaboration capabilities of AWS Supply Chain. In this way, all the communication from those involved in solving this inventory issue is stored and linked to the specific issue instead of happening in a separate channel such as emails. I choose Confirm.

Console screenshot.

Straight from the Stock Out Risk, I can message those that can help me implement the recommendation.

Console screenshot.

I get the reply here, but I prefer to see it in all its context. I choose Collaboration from the navigation pane. There, I find all the conversations started from insights (one for now) and the Stock Out Risk and Resolution recommendations as proposed before. All those collaborating on solving the issue have a clear view of the problem and the possible resolutions. For future reference, this conversation will be available with its risk and resolution context.

Console screenshot.

When the risk is resolved, I move the Stock Out Risk card to Resolved.

Console screenshot.

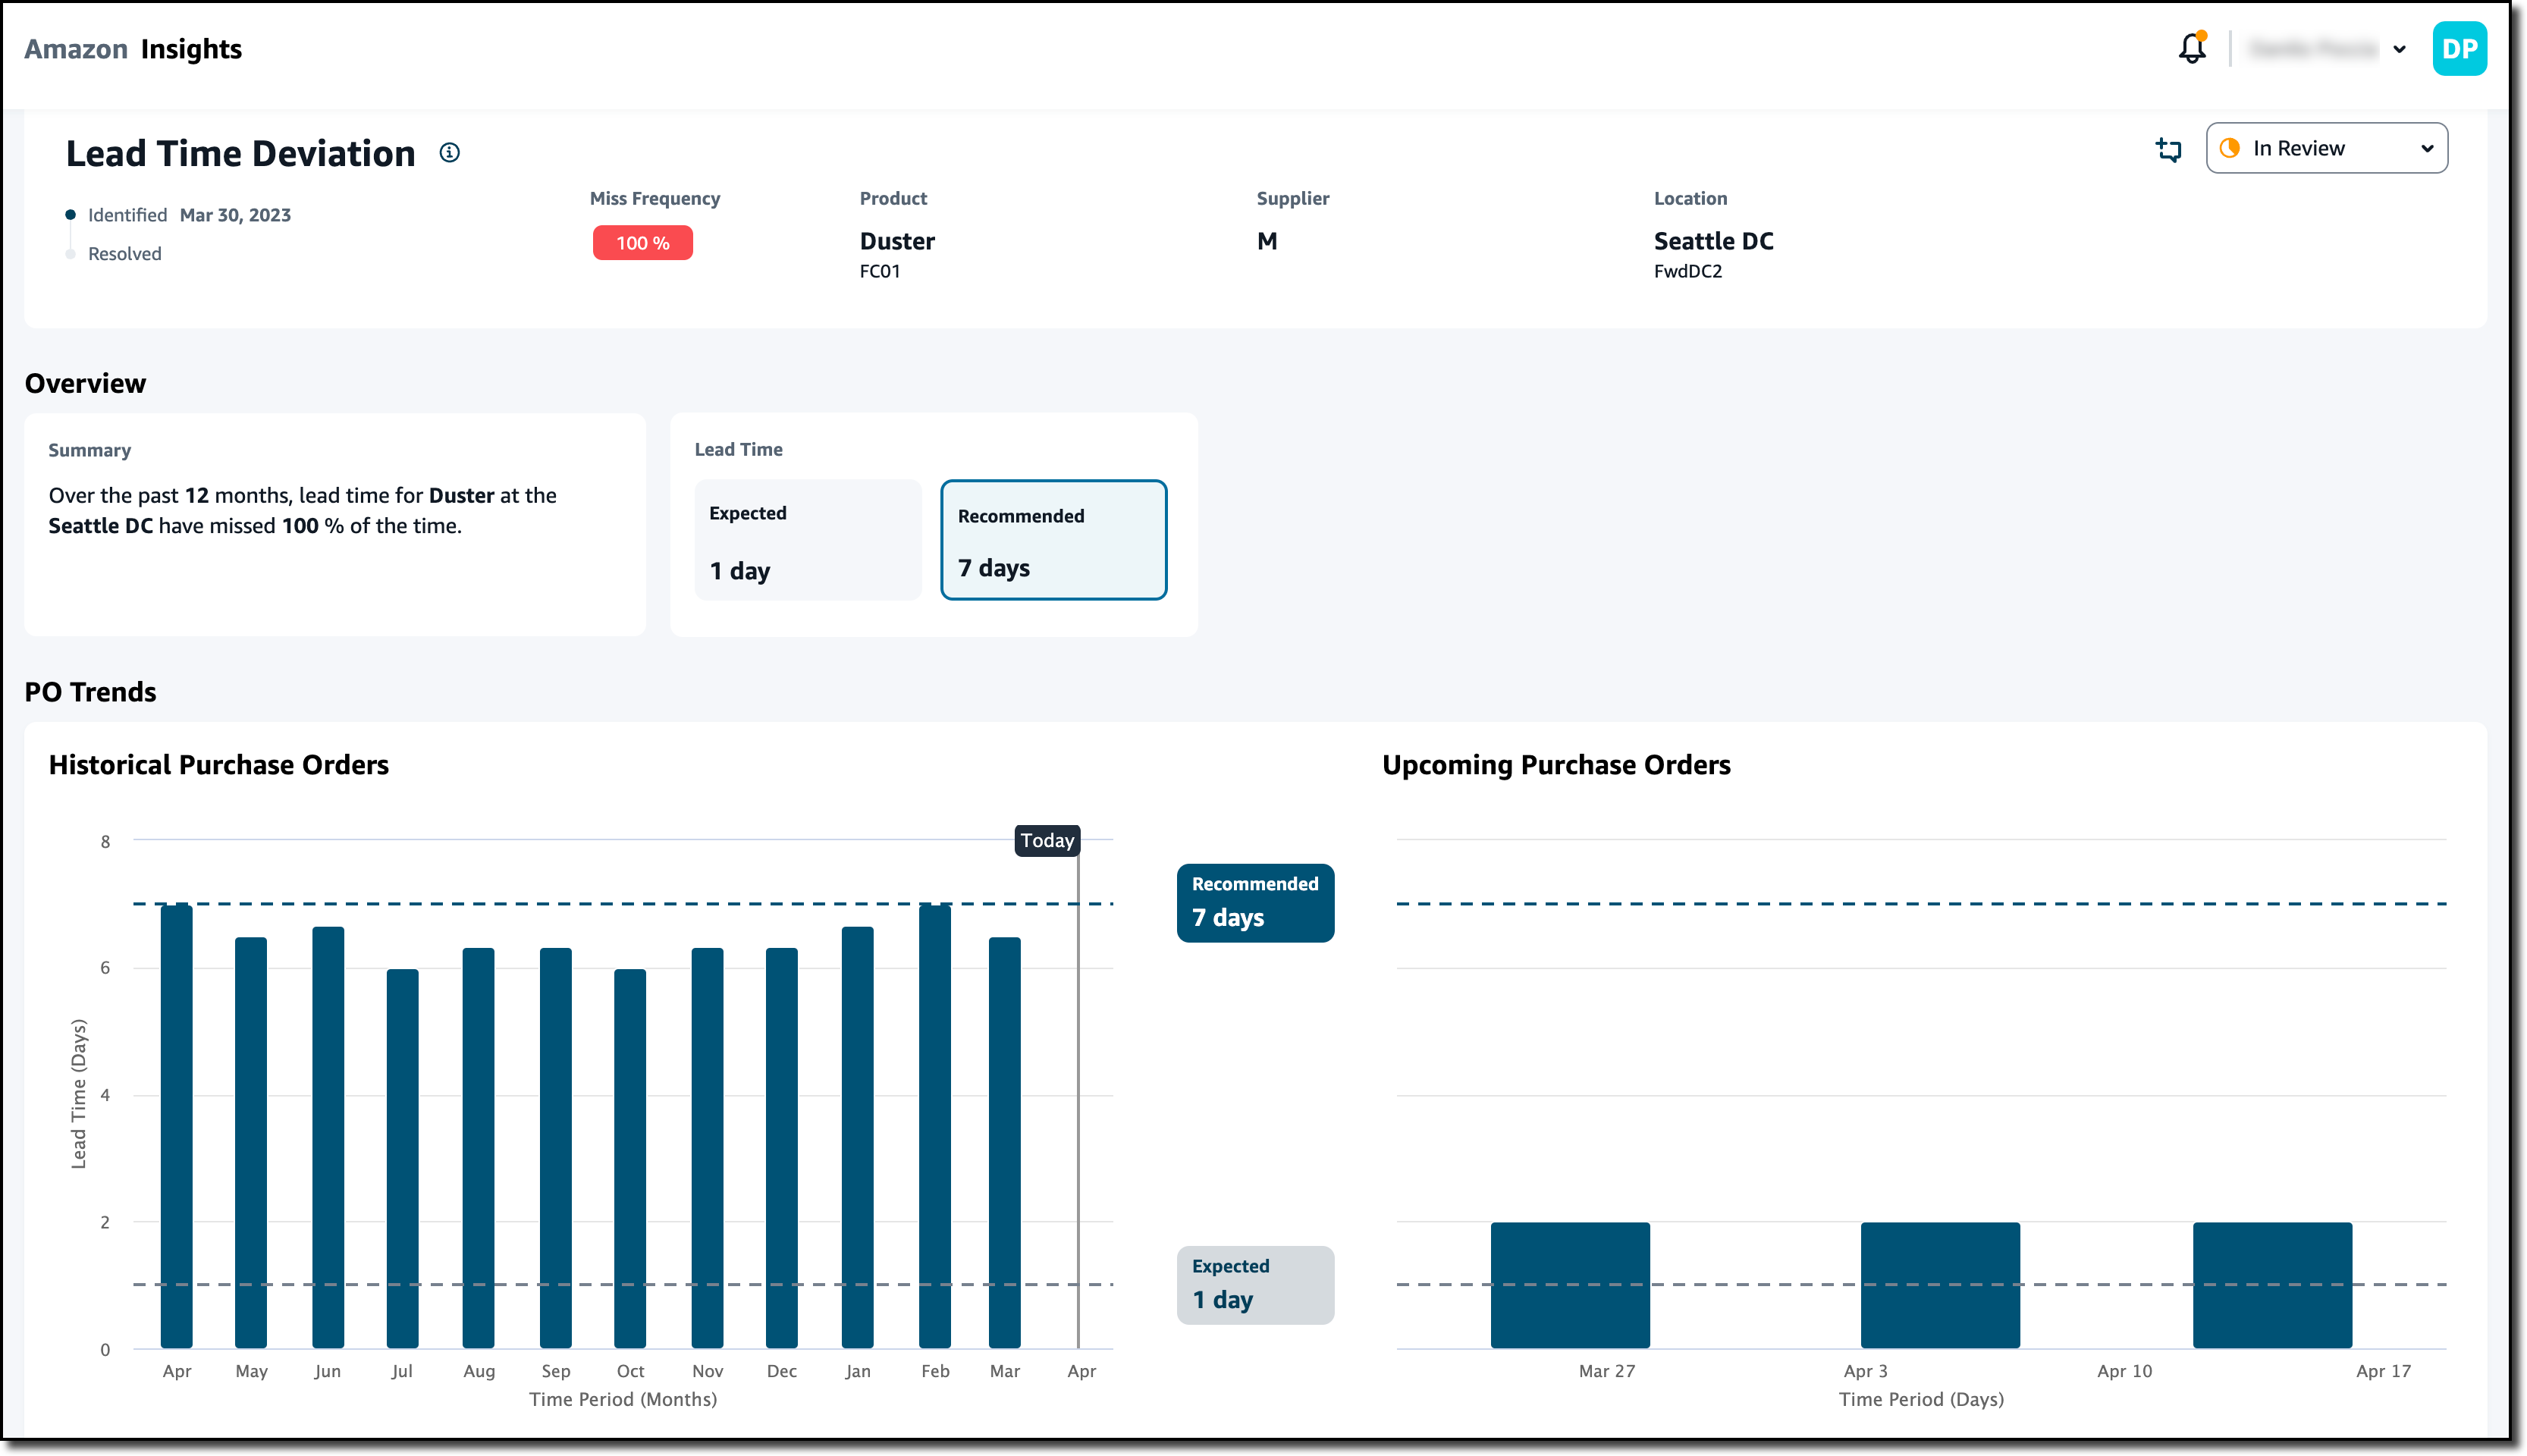
Now, I look at the Lead time insights. Similar to before, I choose an insight and put it In Review. I choose View Details to have more information. I see that, based on historical purchase orders, the recommended lead time for this specific product and location should be seven days and not one day as found in the connected ERP system. This can have a negative impact on the expectations of my customers.
Console screenshot.

Without the need of re-platforming or reimplementing the current systems, I was able to connect AWS Supply Chain and get insights on the inventory of the distribution centers and recommendations based on my personal settings. These recommendations help resolve inventory risks such as items being out of stock or having excess stock in a distribution center. By better understanding the lead time, I can set better expectations for end customers.

Availability and Pricing
AWS Supply Chain is available today in the following AWS Regions: US East (N. Virginia), US West (Oregon), and Europe (Frankfurt).

AWS Supply Chain allows your organization to quickly gain visibility across your supply chain, and it helps you make more informed supply chain decisions. You can use AWS Supply Chain to mitigate overstock and stock-out risks. In this way, you can improve your customer experience, and at the same time, AWS Supply Chain can help you lower excess inventory costs. Using contextual chat and messaging, you can improve the way you collaborate with other teams and resolve issues quickly.

With AWS Supply Chain, you only pay for what you use. There are no required upfront licensing fees or long-term contracts. For more information, see AWS Supply Chain pricing.

Mitigate risk and lower cost of with increased visibility and ML-powered actionable insights for your supply chain.

Danilo


from AWS News Blog https://ift.tt/8pGZKPF
via IFTTT

AWS Week in Review: Public Preview of Amazon DataZone and AWS DataSync Updates – April 3, 2023

Last weekend, I enjoyed the spring vibes at Seoul Forest, a large park in the middle of Seoul city, where cherry blossoms are in full bloom.

Compared to last year, there were crowds of people, so I realized that it was really back to normal after the pandemic. I hope you all enjoy the season of spring or fall with your family.

Last Week’s Launches
Like an April Fool’s Day joke, there were 65 launches last week, far more than usual. AWS product teams are working hard with a customer obsession.

So, I had a lot of trouble choosing the important ones. Other than the ones I’ve picked out, there may be important feature releases that fit your needs. Be sure to take a look at the full launches list in the last week.

First, here is a list of the general availability of AWS services and features treated by AWS News Blog:

Let’s take a look at some launches from the last week that I want to remind you of:

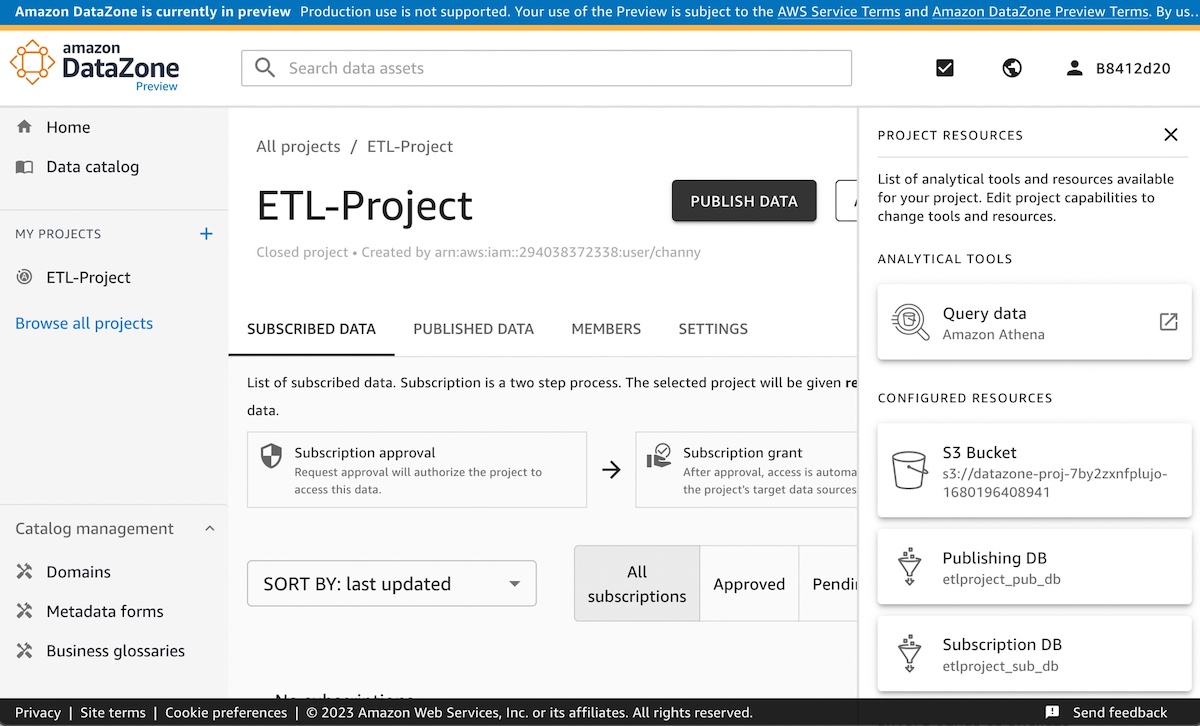
The Preview of Amazon DataZone – At AWS re:Invent 2022, we preannounced Amazon DataZone, a new data management service to catalog, discover, analyze, share, and govern data between data producers and consumers in the organization. You can now try out the public preview of Amazon DataZone.

Data producers populate the business data catalog from AWS Glue Data Catalog and Amazon Redshift tables. Data consumers search for and subscribe to data assets in the data catalog and analyze with tools such as Amazon Athena query editors in the Amazon DataZone portal. To get started with Amazon DataZone, see our Quick Start Guide to include sample datasets to implement a complete use case.

AWS DataSync Supports Azure Blob Storage in PreviewAWS DataSync supports copying your object data at scale from Azure Blob Storage to AWS storage services such as Amazon S3. AWS DataSync supports all blob types within Azure Blob Storage and can also be used with Azure Data Lake Storage (ADLS) Gen 2.

In addition to Azure Blob Storage, DataSync supports Google Cloud Storage and Azure Files storage locations as well as various general storage systems and AWS storage services. To learn more, see Migrating Azure Blob Storage to Amazon S3 using AWS DataSync in the AWS Storage Blog.

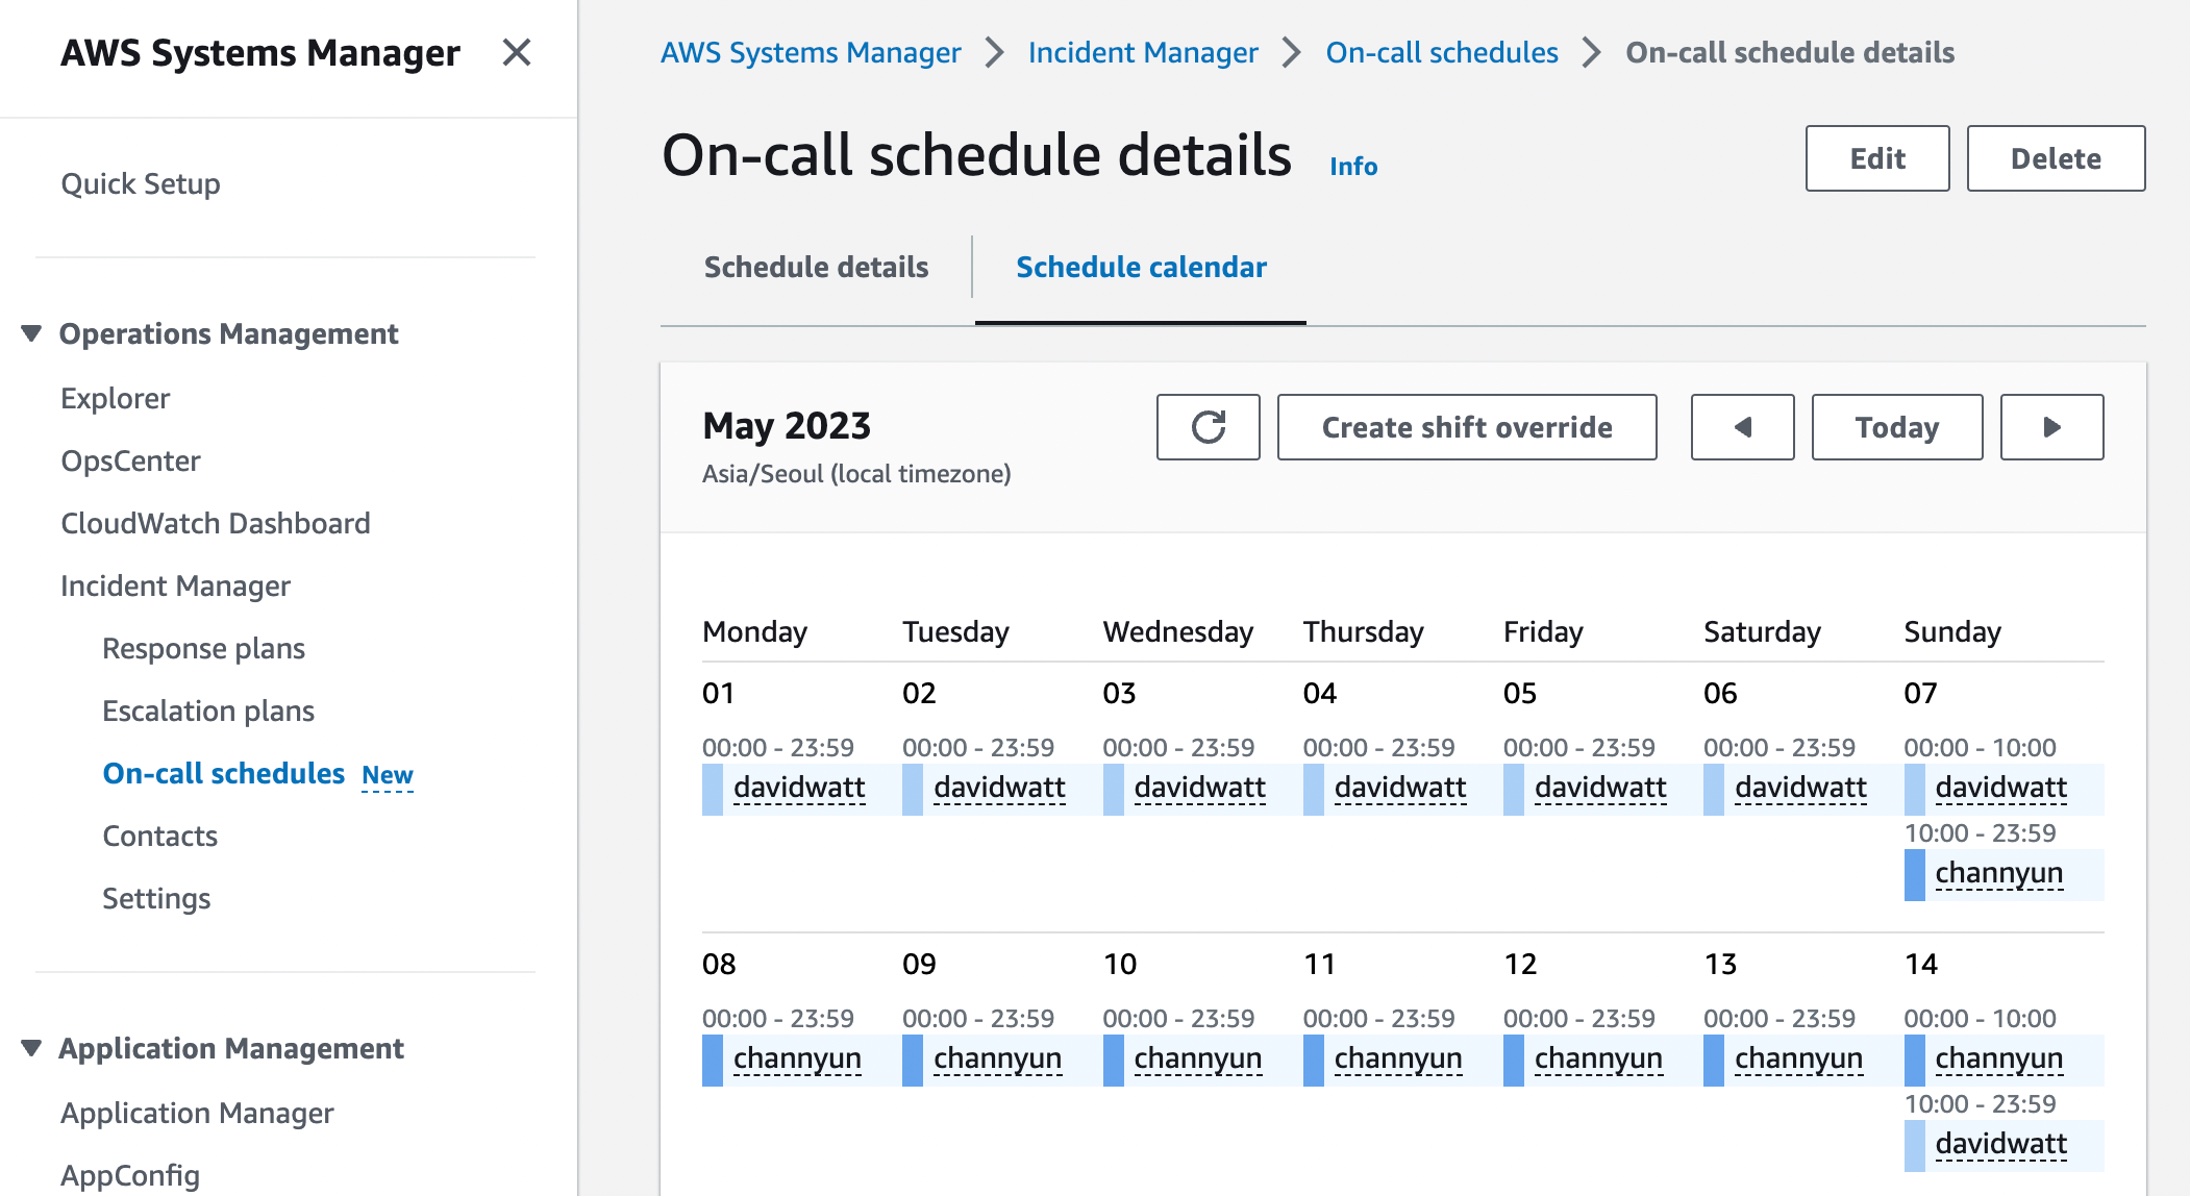
On-call schedules with AWS Systems Manager Incident Manager – You can now configure or change on-call rotation schedules with a group of contacts and have 24/7 coverage and responsiveness for critical issues in the Incident Manager console.

AWS Incident Manager helps you bring the right people and information together when a critical issue is detected, activating preconfigured response plans to engage responders using SMS, phone calls, and chat channels, as well as to run AWS Systems Manager Automation runbooks. To learn how to get started with an-call schedules in Incident Manager, see our Working with on-call schedules in Incident Manager in the AWS documentation.

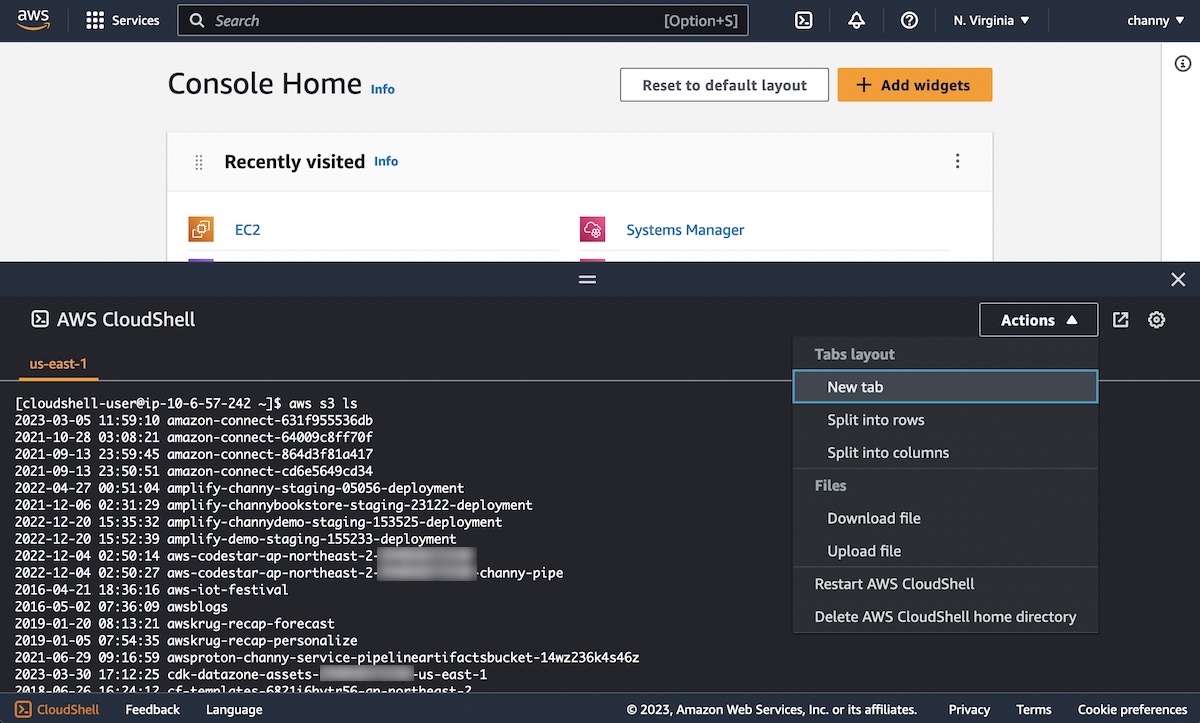
AWS CloudShell Colsone Toolbar – You can now use AWS Cloudshell Console Toolbar with AWS Management Console in a single view. The Console Toolbar maintains its state (e.g., open, closed) and commands will continue to run in CloudShell as you navigate between services in the Console. For example, it allows you to run a command in CloudShell and view a CloudWatch alarm in the Console at the same time.

After signing into the Console, you can access CloudShell in the lower left of the Console by selecting the CloudShell icon in the Console Toolbar.

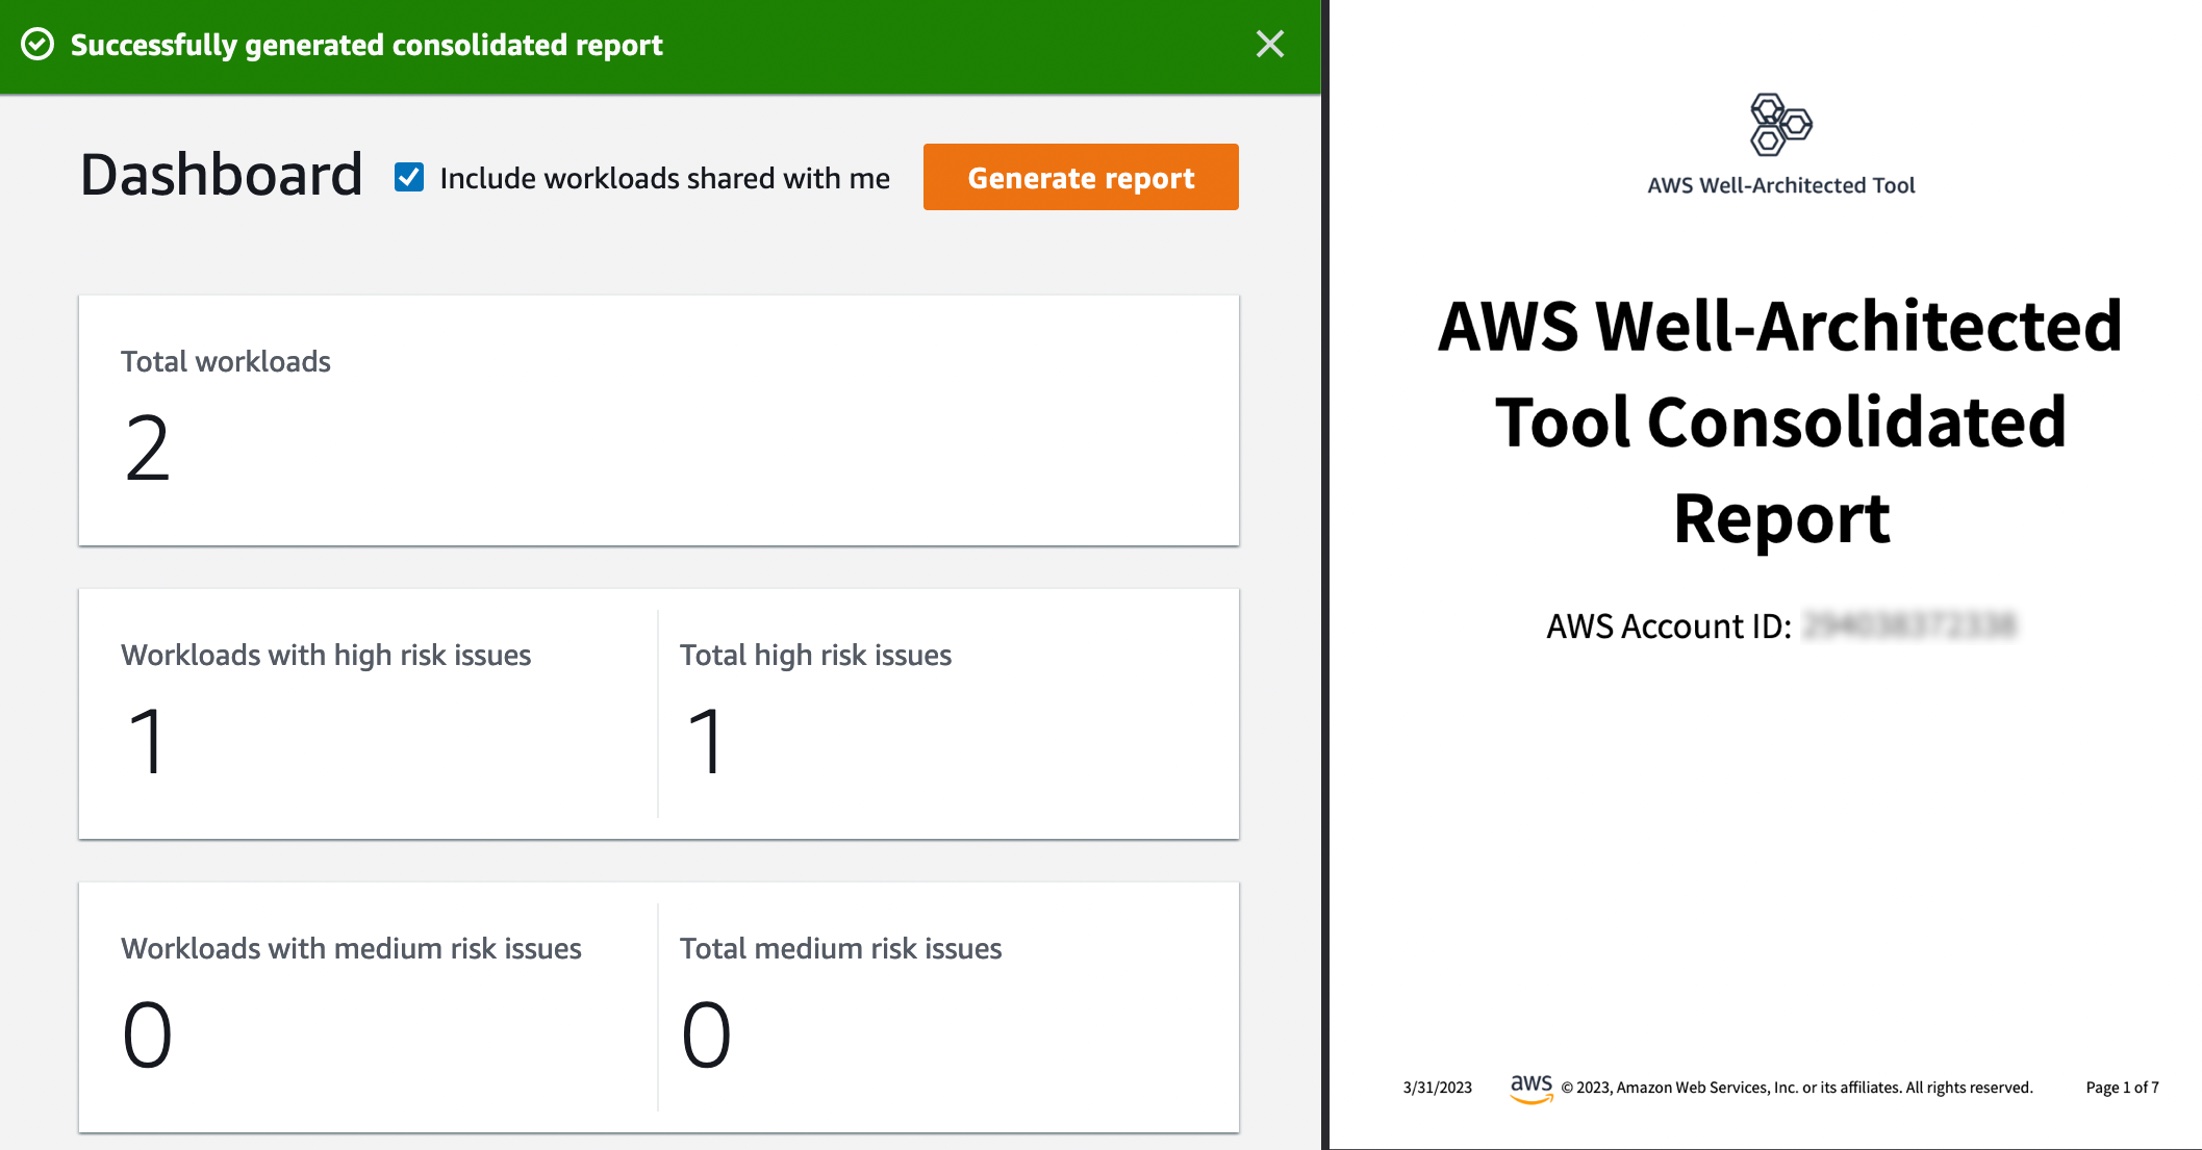
New Features of AWS Well-Architected Tool – The Consolidated Report and Enhanced Search enable customers to quickly identify risk themes across their workloads and scale improvements across their organization. This macro-level view helps executive stakeholders understand where common issues lie and prioritize team resources to drive widespread improvement. To learn more, see AWS Well-Architected Tool Dashboard in the AWS documentation.

For a full list of AWS announcements, be sure to keep an eye on the What’s New at AWS page.

Other AWS News
Here are some other news items that you may find interesting from the last week:

Welcome to the .NET on AWS Blog – We launched a new blog channel for millions of .NET developers across the world. Blog posts will also cover built-for-the-cloud development, modernizing .NET Framework applications, and how to deploy .NET workloads on different AWS services. We will use this channel to share news on the work we’ve done with the .NET open-source community, post follow-ups from important events, and post announcements about upcoming presentations from our .NET developer advocates. To learn more, visit our .NET on AWS website and follow us on Twitter at @dotnetonAWS.

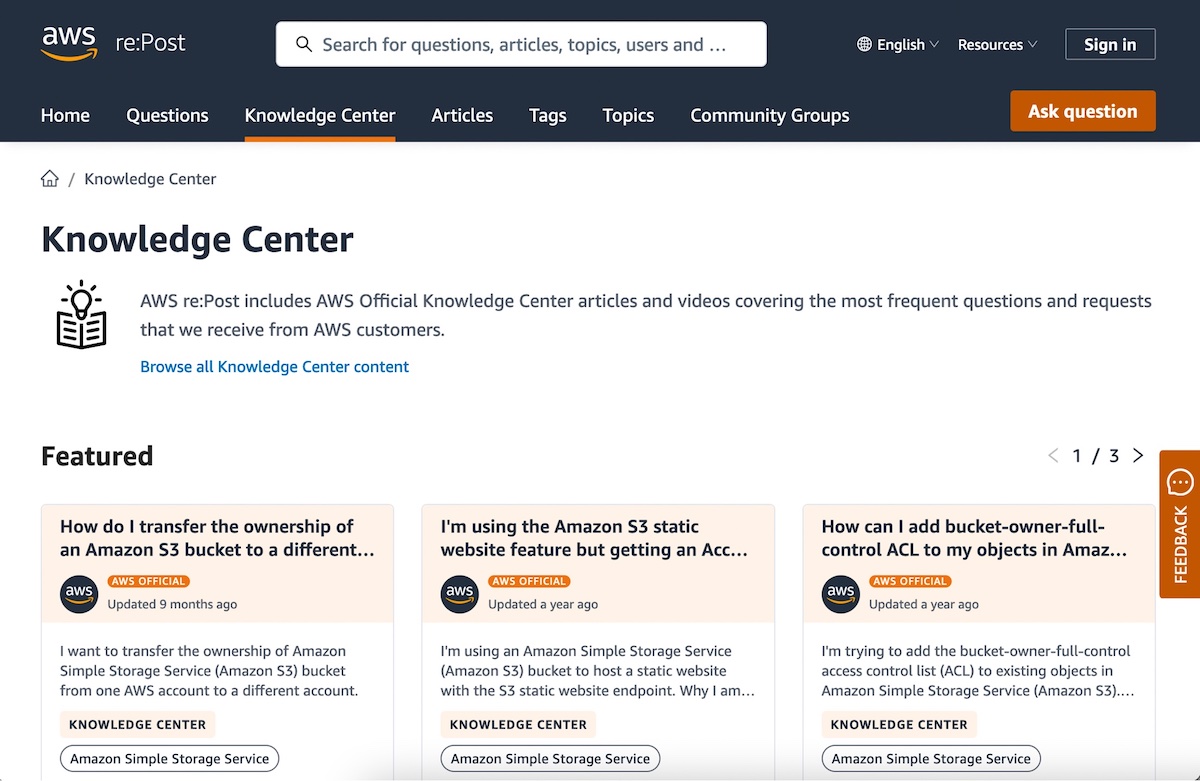
AWS Knowledge Center in AWS re:Post – You can now access trusted, authoritative articles and videos of AWS Knowledge Center on AWS re:Post to get answers to technical questions. Knowledge Center content is produced by an AWS team and covers the most frequent questions and requests from AWS customers. These articles are available in 10 localized languages: English, French, German, Italian, Japanese, Korean, Portuguese, Simplified Chinese, Spanish, and Traditional Chinese.

TF1’s FIFA Worldcup Digital Broadcasting Story – Sébastien shared an awesome story about how the French broadcaster TF1 use AWS Cloud technology and expertise to bring the FIFA World Cup to millions of people. He shared the history of redesigning its digital broadcasting architecture on AWS, testing the new platform on large-scale sporting events. For the preparation of the FIFA Worldcup event, TF1 enhanced monitoring to detect anomalies during the event and established the backup plan in a “war room” for the worst scenario. Even if you’re not a fan of football, I recommend reading the behind-the-scenes of the FIFA Worldcup Finals. It’s long but really fun!

Upcoming AWS Events
Check your calendars and sign up for these AWS-led events:

AWS re:Inforce 2023 – Now register AWS re:Inforce, in Anaheim, California, June 13–14. AWS Chief Information Security Officer CJ Moses will share the latest innovations in cloud security and what AWS Security is focused on. The breakout sessions will provide real-world examples of how security is embedded into the way businesses operate. To learn more and get the limited discount code to register, see CJ’s blog post of Gain insights and knowledge at AWS re:Inforce 2023 in the AWS Security Blog.

AWS Global Summits – Check your calendars and sign up for the AWS Summit closest to your city: Paris and Sydney (April 4), Seoul (May 3-4), Berlin and Singapore (May 4), Stockholm (May 11), Hong Kong (May 23), Amsterdam (June 1), London (June 7), Madrid (June 15), and Milano (June 22).

AWS Community Day – Join community-led conferences driven by AWS user group leaders closest to your city: Peru (April 15), Helsinki (April 20), Chicago (June 15), Philippines (June 29–30), and Munich (September 14). Recently, we are bringing together AWS user groups from around the world into Meetup Pro accounts. Find your group and its meetups in your city!
You can browse all upcoming AWS-led in-person and virtual events, and developer-focused events such as AWS DevDay.

That’s all for this week. Check back next Monday for another Week in Review!

— Channy

This post is part of our Week in Review series. Check back each week for a quick roundup of interesting news and announcements from AWS!


from AWS News Blog https://ift.tt/hQL8B1G
via IFTTT

Friday, March 31, 2023

New – Ready-to-use Models and Support for Custom Text and Image Classification Models in Amazon SageMaker Canvas

Today AWS announces new features in Amazon SageMaker Canvas that help business analysts generate insights from thousands of documents, images, and lines of text in minutes with machine learning (ML). Starting today, you can access ready-to-use models and create custom text and image classification models alongside previously supported custom models for tabular data, all without requiring ML experience or writing a line of code.

Business analysts across different industries want to apply AI/ML solutions to generate insights from a variety of data and respond to ad-hoc analysis requests coming from business stakeholders. By applying AI/ML in their workflows, analysts can automate manual, time-consuming, and error-prone processes, such as inspection, classification, as well as extraction of insights from raw data, images, or documents. However, applying AI/ML to business problems requires technical expertise and building custom models can take several weeks or even months.

Launched in 2021, Amazon SageMaker Canvas is a visual, point-and-click service that allows business analysts to use a variety of ready-to-use models or create custom models to generate accurate ML predictions on their own.

Ready-to-use Models
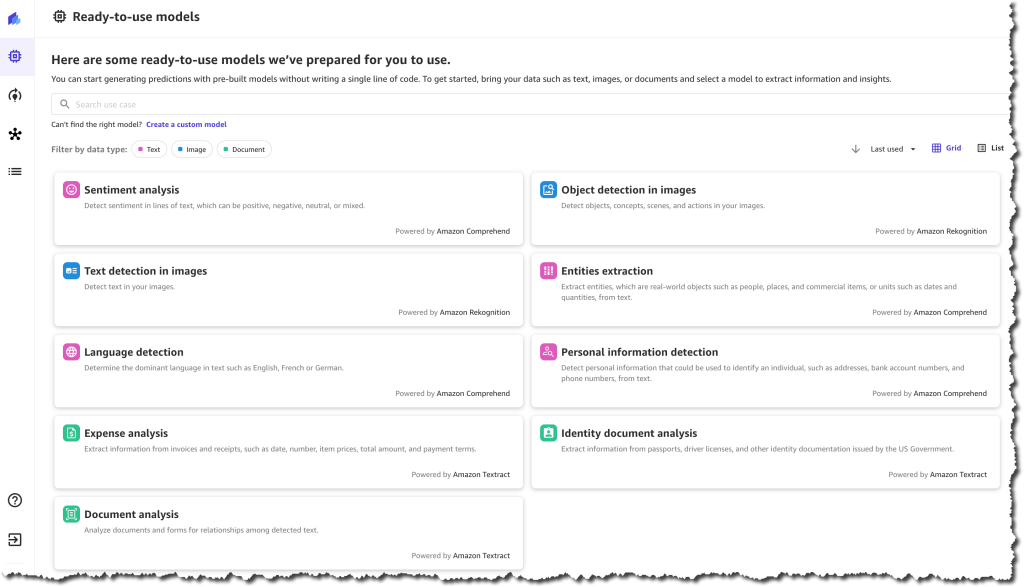
Customers can use SageMaker Canvas to access ready-to-use models that can be used to extract information and generate predictions from thousands of documents, images, and lines of text in minutes. These ready-to-use models include sentiment analysis, language detection, entity extraction, personal information detection, object and text detection in images, expense analysis for invoices and receipts, identity document analysis, and more generalized document and form analysis.

For example, you can select the sentiment analysis ready-to-use model and upload product reviews from social media and customer support tickets to quickly understand how your customers feel about your products. Using the personal information detection ready-to-use model, you can detect and redact personally identifiable information (PII) from emails, support tickets, and documents. Using the expense analysis ready-to-use model, you can easily detect and extract data from your scanned invoices and receipts and generate insights about that data.

These ready-to-use models are powered by AWS AI services, including Amazon Rekognition, Amazon Comprehend, and Amazon Textract.

Ready-to-use models available

Custom Text and Image Classification Models
Customers that need custom models trained for their business-specific use-case can use SageMaker Canvas to create text and image classification models. 

You can use SageMaker Canvas to create custom text classification models to classify data according to your needs. For example, imagine that you work as a business analyst at a company that provides customer support. When a customer support agent engages with a customer, they create a ticket, and they need to record the ticket type, for example, “incident”, “service request”, or “problem”. Many times, this field gets forgotten, and so, when the reporting is done, the data is hard to analyze. Now, using SageMaker Canvas, you can create a custom text classification model, train it with existing customer support ticket information and ticket type, and use it to predict the type of tickets in the future when working on a report with missing data.

You can also use SageMaker Canvas to create custom image classification models using your own image datasets. For instance, imagine you work as a business analyst at a company that manufactures smartphones. As part of your role, you need to prepare reports and respond to questions from business stakeholders related to quality assessment and it’s trends. Every time a phone is assembled, a picture is automatically taken, and at the end of the week, you receive all those images. Now with SageMaker Canvas, you can create a new custom image classification model that is trained to identify common manufacturing defects. Then, every week, you can use the model to analyze the images and predict the quality of the phones produced.

SageMaker Canvas in Action
Let’s imagine that you are a business analyst for an e-commerce company. You have been tasked with understanding the customer sentiment towards all the new products for this season. Your stakeholders require a report that aggregates the results by item category to decide what inventory they should purchase in the following months. For example, they want to know if the new furniture products have received positive sentiment. You have been provided with a spreadsheet containing reviews for the new products, as well as an outdated file that categorizes all the products on your e-commerce platform. However, this file does not yet include the new products.

To solve this problem, you can use SageMaker Canvas. First, you will need to use the sentiment analysis ready-to-use model to understand the sentiment for each review, classifying them as positive, negative, or neutral. Then, you will need to create a custom text classification model that predicts the categories for the new products based on the existing ones.

Ready-to-use Model – Sentiment Analysis
To quickly learn the sentiment of each review, you can do a bulk update of the product reviews and generate a file with all the sentiment predictions.

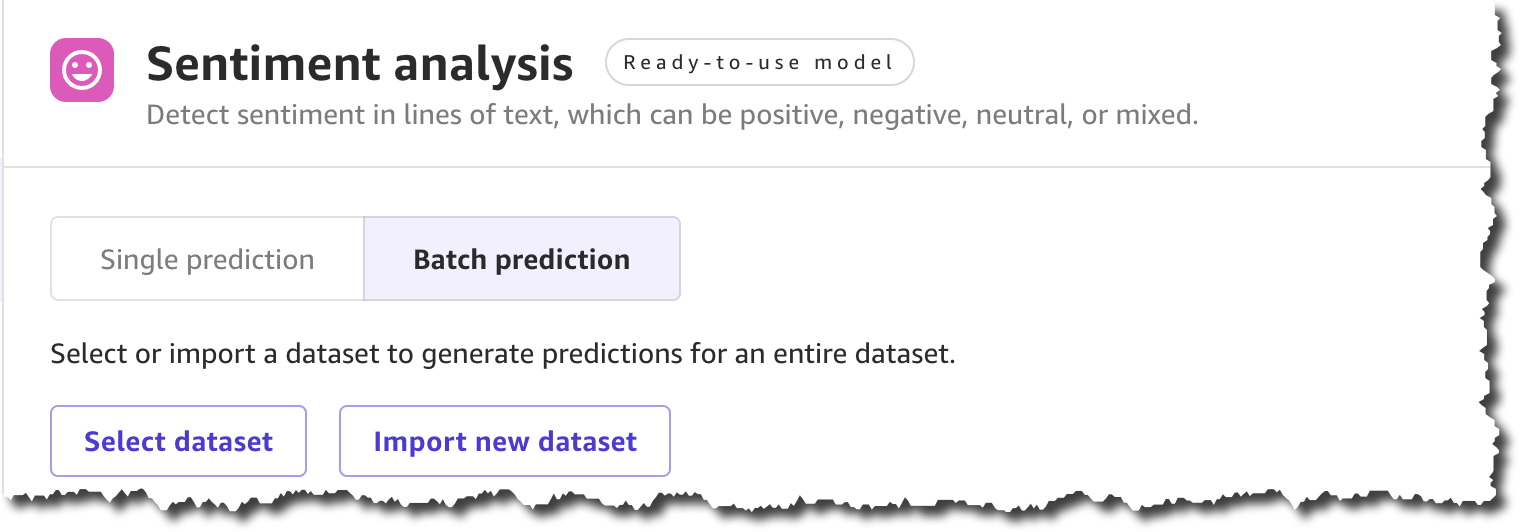
To get started, locate Sentiment analysis on the Ready-to-use models page, and under Batch prediction, select Import new dataset.

Using ready-to-use sentiment analysis with a batch dataset

When you create a new dataset, you can upload the dataset from your local machine or use Amazon Simple Storage Service (Amazon S3). For this demo, you will upload the file locally. You can find all the product reviews used in this example in the Amazon Customer Reviews dataset.

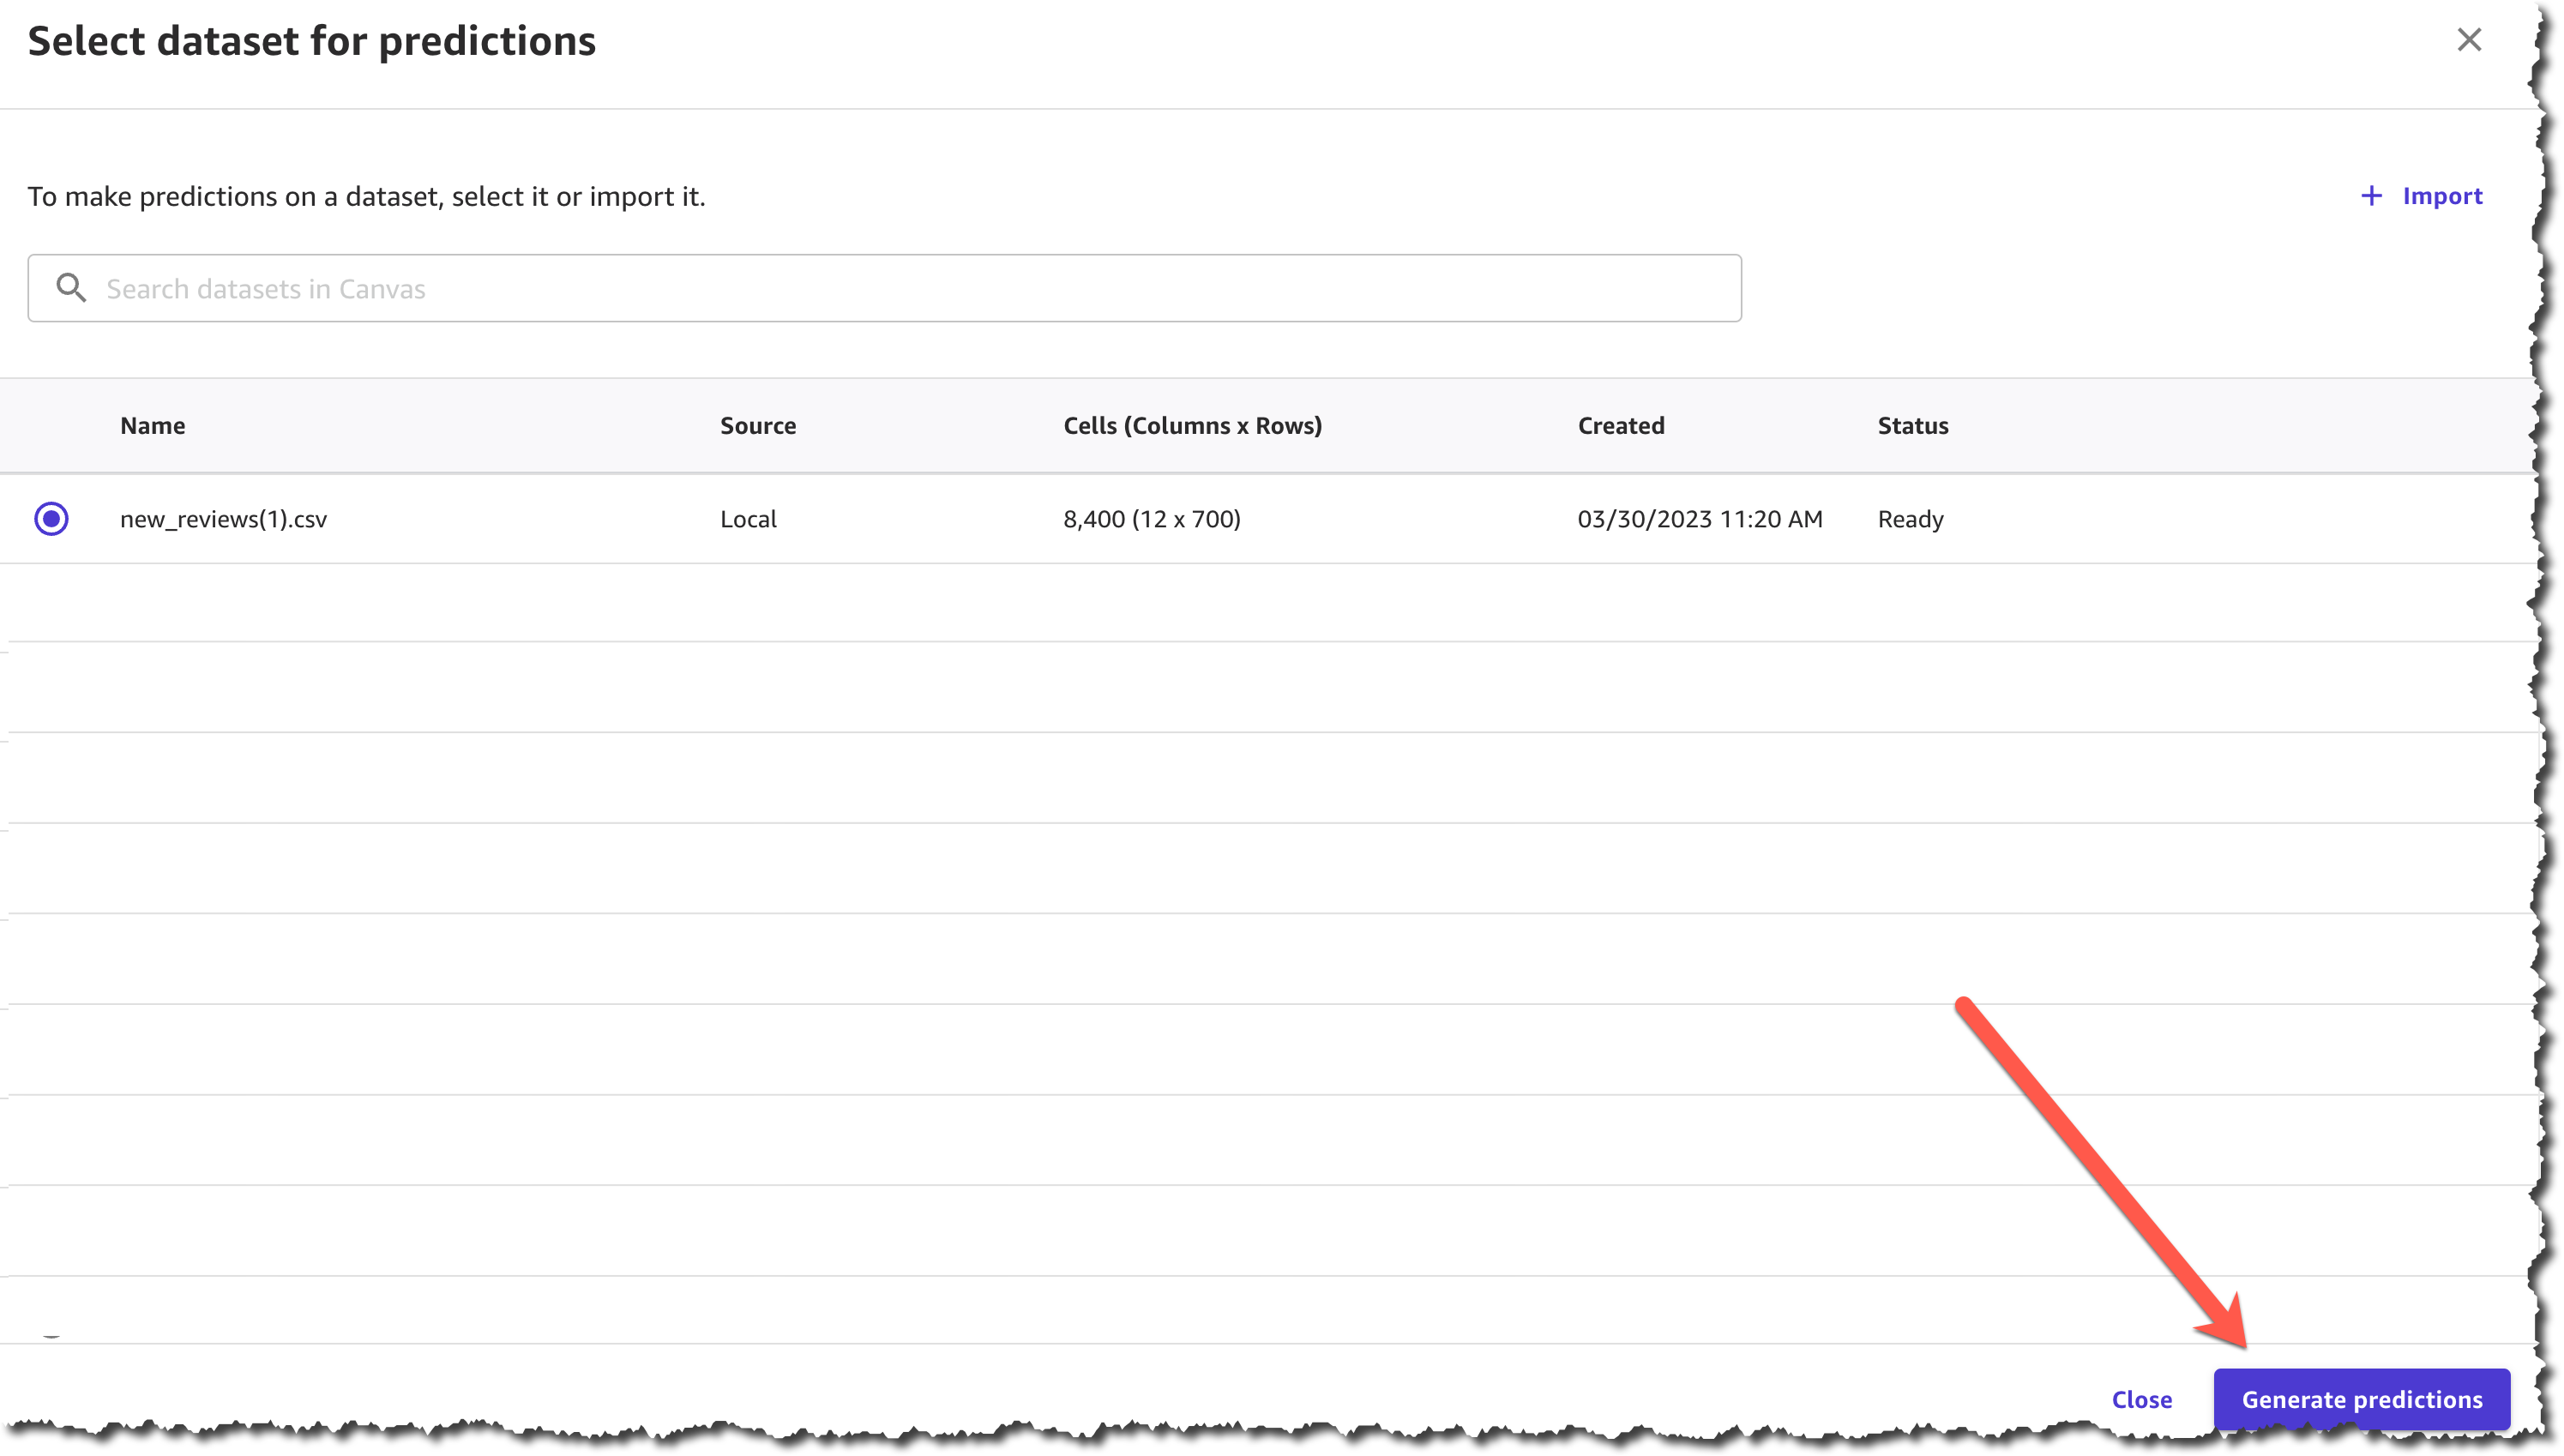
After you complete uploading the file and creating the dataset, you can Generate predictions.

Select dataset and generate predictions

The prediction generation takes less than a minute, depending on the size of the dataset, and then you can view or download the results.

View or download predictions

The results from this prediction can be downloaded as a .csv file or viewed from the SageMaker Canvas interface. You can see the sentiment for each of the product reviews.

Preview results from ready-to-use model

Now you have the first part of your task ready—you have a .csv file with the sentiment of each review. The next step is to classify those products into categories.

Custom Text Classification Model
To classify the new products into categories based on the product title, you need to train a new text classification model in SageMaker Canvas.

In SageMaker Canvas, create a New model of the type Text analysis.

The first step when creating the model is to select a dataset with which to train the model. You will train this model with a dataset from last season, which contains all the products except for the new collection.

Once the dataset has finished importing, you will need to select the column that contains the data you want to predict, which in this case is the product_category column, and the column that will be used as the input for the model to make predictions, which is the product_title column.

After you finish configuring that, you can start to build the model. There are two modes of building:

  • Quick build that returns a model in 15–30 minutes.
  • Standard build takes 2–5 hours to complete.

To learn more about the differences between the modes of building you can check the documentation. For this demo, pick quick build, as our dataset is smaller than 50,000 rows.

Prepare and build your model

When the model is built, you can analyze how the model performs. SageMaker Canvas uses the 80-20 approach; it trains the model with 80 percent of the data from the dataset and uses 20 percent of the data to validate the model.

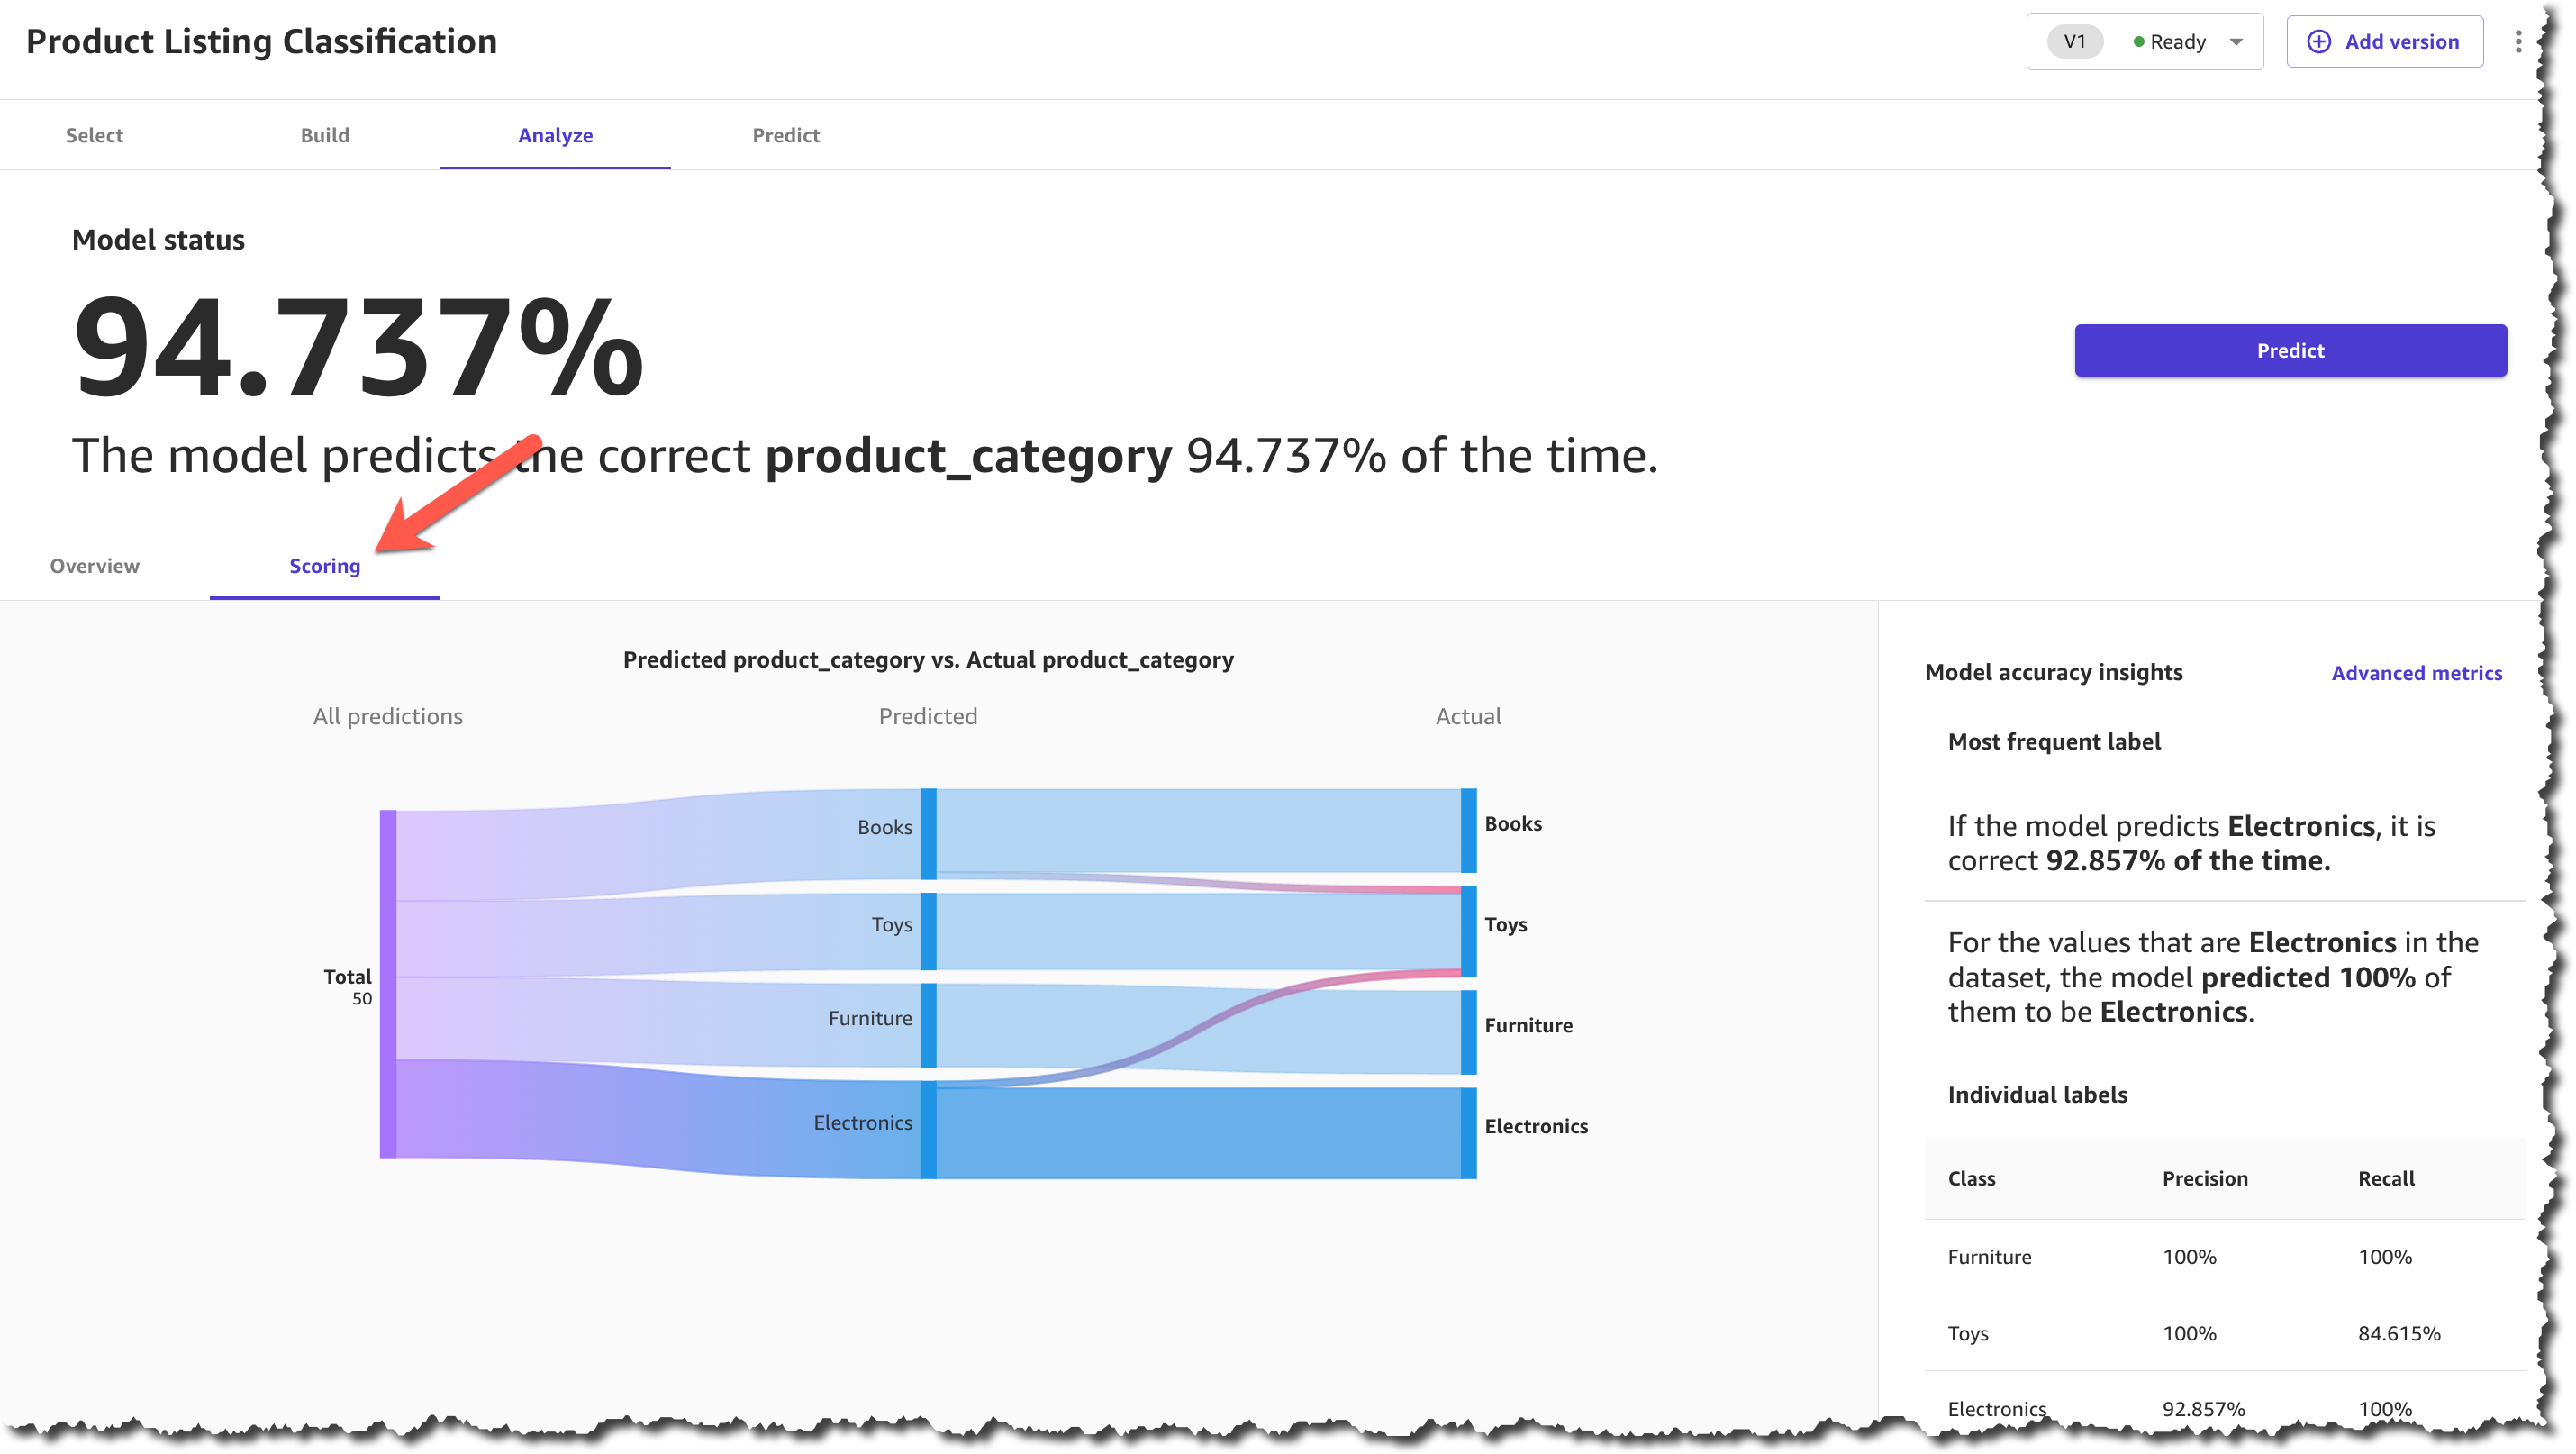
Model score

When the model finishes building, you can check the model score. The scoring section gives you a visual sense of how accurate the predictions were for each category. You can learn more about how to evaluate your model’s performance in the documentation.

After you make sure that your model has a high prediction rate, you can move on to generate predictions. This step is similar to the ready-to-use models for sentiment analysis. You can make a prediction on a single product or on a set of products. For a batch prediction, you need to select a dataset and let the model generate the predictions. For this example, you will select the same dataset that you selected in the ready-to-use model, the one with the reviews. This can take a few minutes, depending on the number of products in the dataset.

When the predictions are ready, you can download the results as a .csv file or view how each product was classified. In the prediction results, each product is assigned only one category based on the categories provided during the model-building process.

Predict categories

Now you have all the necessary resources to conduct an analysis and evaluate the performance of each product category with the new collection based on customer reviews. Using SageMaker Canvas, you were able to access a ready-to-use model and create a custom text classification model without having to write a single line of code.

Available Now
Ready-to-use models and support for custom text and image classification models in SageMaker Canvas are available in all AWS Regions where SageMaker Canvas is available. You can learn more about the new features and how they are priced by visiting the SageMaker Canvas product detail page.

— Marcia


from AWS News Blog https://ift.tt/D7lI8xX
via IFTTT

Simplify Service-to-Service Connectivity, Security, and Monitoring with Amazon VPC Lattice – Now Generally Available

At AWS re:Invent 2022, we introduced in preview Amazon VPC Lattice, a new capability of Amazon Virtual Private Cloud (Amazon VPC) that gives you a consistent way to connect, secure, and monitor communication between your services. With VPC Lattice, you can define policies for network access, traffic management, and monitoring to connect compute services across instances, containers, and serverless applications.

Today, I am happy to share that VPC Lattice is now generally available. Compared to the preview, you have access to new capabilities:

  • Services can use a custom domain name in addition to the domain name automatically generated by VPC Lattice. When using HTTPS, you can configure an SSL/TLS certificate that matches the custom domain name.
  • You can deploy the open-source AWS Gateway API Controller to use VPC Lattice with a Kubernetes-native experience. It uses the Kubernetes Gateway API to let you connect services across multiple Kubernetes clusters and services running on EC2 instances, containers, and serverless functions.
  • You can use an Application Load Balancer (ALB) or a Network Load Balancer (NLB) as a target for a service.
  • The IP address target type now supports IPv6 connectivity.

Let’s see some of these new features in practice.

Using Amazon VPC Lattice for Service-to-Service Connectivity
In my previous post introducing VPC Lattice, I show how to create a service network, associate multiple VPCs and services, and configure target groups for EC2 instances and Lambda functions. There, I also show how to route traffic based on request characteristics and how to use weighted routing. Weighted routing is really handy for blue/green and canary-style deployments or for migrating from one compute platform to another.

Now, let’s see how to use VPC Lattice to allow the services of an e-commerce application to communicate with each other. For simplicity, I only consider four services:

  • The Order service, running as a Lambda function.
  • The Inventory service, deployed as an Amazon Elastic Container Service (Amazon ECS) service in a dual-stack VPC supporting IPv6.
  • The Delivery service, deployed as an ECS service using an ALB to distribute traffic to the service tasks.
  • The Payment service, running on an EC2 instance.

First, I create a service network. The Order service needs to call the Inventory service (to check if an item is available for purchase), the Delivery service (to organize the delivery of the item), and the Payment service (to transfer the funds). The following diagram shows the service-to-service communication from the perspective of the service network.

Diagram describing the service network view of the e-commerce services.

These services run in different AWS accounts and multiple VPCs. VPC Lattice handles the complexity of setting up connectivity across VPC boundaries and permission across accounts so that service-to-service communication is as simple as an HTTP/HTTPS call.

The following diagram shows how the communication flows from an implementation point of view.

Diagram describing the implementation view of the e-commerce services.

The Order service runs in a Lambda function connected to a VPC. Because all the VPCs in the diagram are associated with the service network, the Order service is able to call the other services (Inventory, Delivery, and Payment) even if they are deployed in different AWS accounts and in VPCs with overlapping IP addresses.

Using a Network Load Balancer (NLB) as Target
The Inventory service runs in a dual-stack VPC. It’s deployed as an ECS service with an NLB to distribute traffic to the tasks in the service. To get the IPv6 addresses of the NLB, I look for the network interfaces used by the NLB in the EC2 console.

Console screenshot.

When creating the target group for the Inventory service, under Basic configuration, I choose IP addresses as the target type. Then, I select IPv6 for the IP Address type.

Console screenshot.

In the next step, I enter the IPv6 addresses of the NLB as targets. After the target group is created, the health checks test the targets to see if they are responding as expected.

Console screenshot.

Using an Application Load Balancer (ALB) as Target
Using an ALB as a target is even easier. When creating a target group for the Delivery service, under Basic configuration, I choose the new Application Load Balancer target type.

Console screenshot.

I select the VPC in which to look for the ALB and choose the Protocol version.

Console screenshot.

In the next step, I choose Register now and select the ALB from the dropdown. I use the default port used by the target group. VPC Lattice does not provide additional health checks for ALBs. However, load balancers already have their own health checks configured.

Console screenshot.

Using Custom Domain Names for Services
To call these services, I use custom domain names. For example, when I create the Payment service in the VPC console, I choose to Specify a custom domain configuration, enter a Custom domain name, and select an SSL/TLS certificate for the HTTPS listener. The Custom SSL/TLS certificate dropdown shows available certificates from AWS Certificate Manager (ACM).

Console screenshot.

Securing Service-to-Service Communications
Now that the target groups have been created, let’s see how I can secure the way services communicate with each other. To implement zero-trust authentication and authorization, I use AWS Identity and Access Management (IAM). When creating a service, I select the AWS IAM as Auth type.

I select the Allow only authenticated access policy template so that requests to services need to be signed using Signature Version 4, the same signing protocol used by AWS APIs. In this way, requests between services are authenticated by their IAM credentials, and I don’t have to manage secrets to secure their communications.

Console screenshot.

Optionally, I can be more precise and use an auth policy that only gives access to some services or specific URL paths of a service. For example, I can apply the following auth policy to the Order service to give to the Lambda function these permissions:

  • Read-only access (GET method) to the Inventory service /stock URL path.
  • Full access (any HTTP method) to the Delivery service /delivery URL path.
{
    "Version": "2012-10-17",
    "Statement": [
        {
            "Effect": "Allow",
            "Principal": {
                "AWS": "<Order Service Lambda Function IAM Role ARN>"
            },
            "Action": "vpc-lattice-svcs:Invoke",
            "Resource": "<Inventory Service ARN>/stock",
            "Condition": {
                "StringEquals": {
                    "vpc-lattice-svcs:RequestMethod": "GET"
                }
            }
        },
        {
            "Effect": "Allow",
            "Principal": {
                "AWS": "<Order Service Lambda Function IAM Role ARN>"
            },
            "Action": "vpc-lattice-svcs:Invoke",
            "Resource": "<Delivery Service ARN>/delivery"
        }
    ]
}

Using VPC Lattice, I quickly configured the communication between the services of my e-commerce application, including security and monitoring. Now, I can focus on the business logic instead of managing how services communicate with each other.

Availability and Pricing
Amazon VPC Lattice is available today in the following AWS Regions: US East (Ohio), US East (N. Virginia), US West (Oregon), Asia Pacific (Singapore), Asia Pacific (Sydney), Asia Pacific (Tokyo), and Europe (Ireland).

With VPC Lattice, you pay for the time a service is provisioned, the amount of data transferred through each service, and the number of requests. There is no charge for the first 300,000 requests every hour, and you only pay for requests above this threshold. For more information, see VPC Lattice pricing.

We designed VPC Lattice to allow incremental opt-in over time. Each team in your organization can choose if and when to use VPC Lattice. Other applications can connect to VPC Lattice services using standard protocols such as HTTP and HTTPS. By using VPC Lattice, you can focus on your application logic and improve productivity and deployment flexibility with consistent support for instances, containers, and serverless computing.

Simplify the way you connect, secure, and monitor your services with VPC Lattice.

Danilo


from AWS News Blog https://ift.tt/78yUNVP
via IFTTT

Thursday, March 30, 2023

Amazon GuardDuty Now Supports Amazon EKS Runtime Monitoring

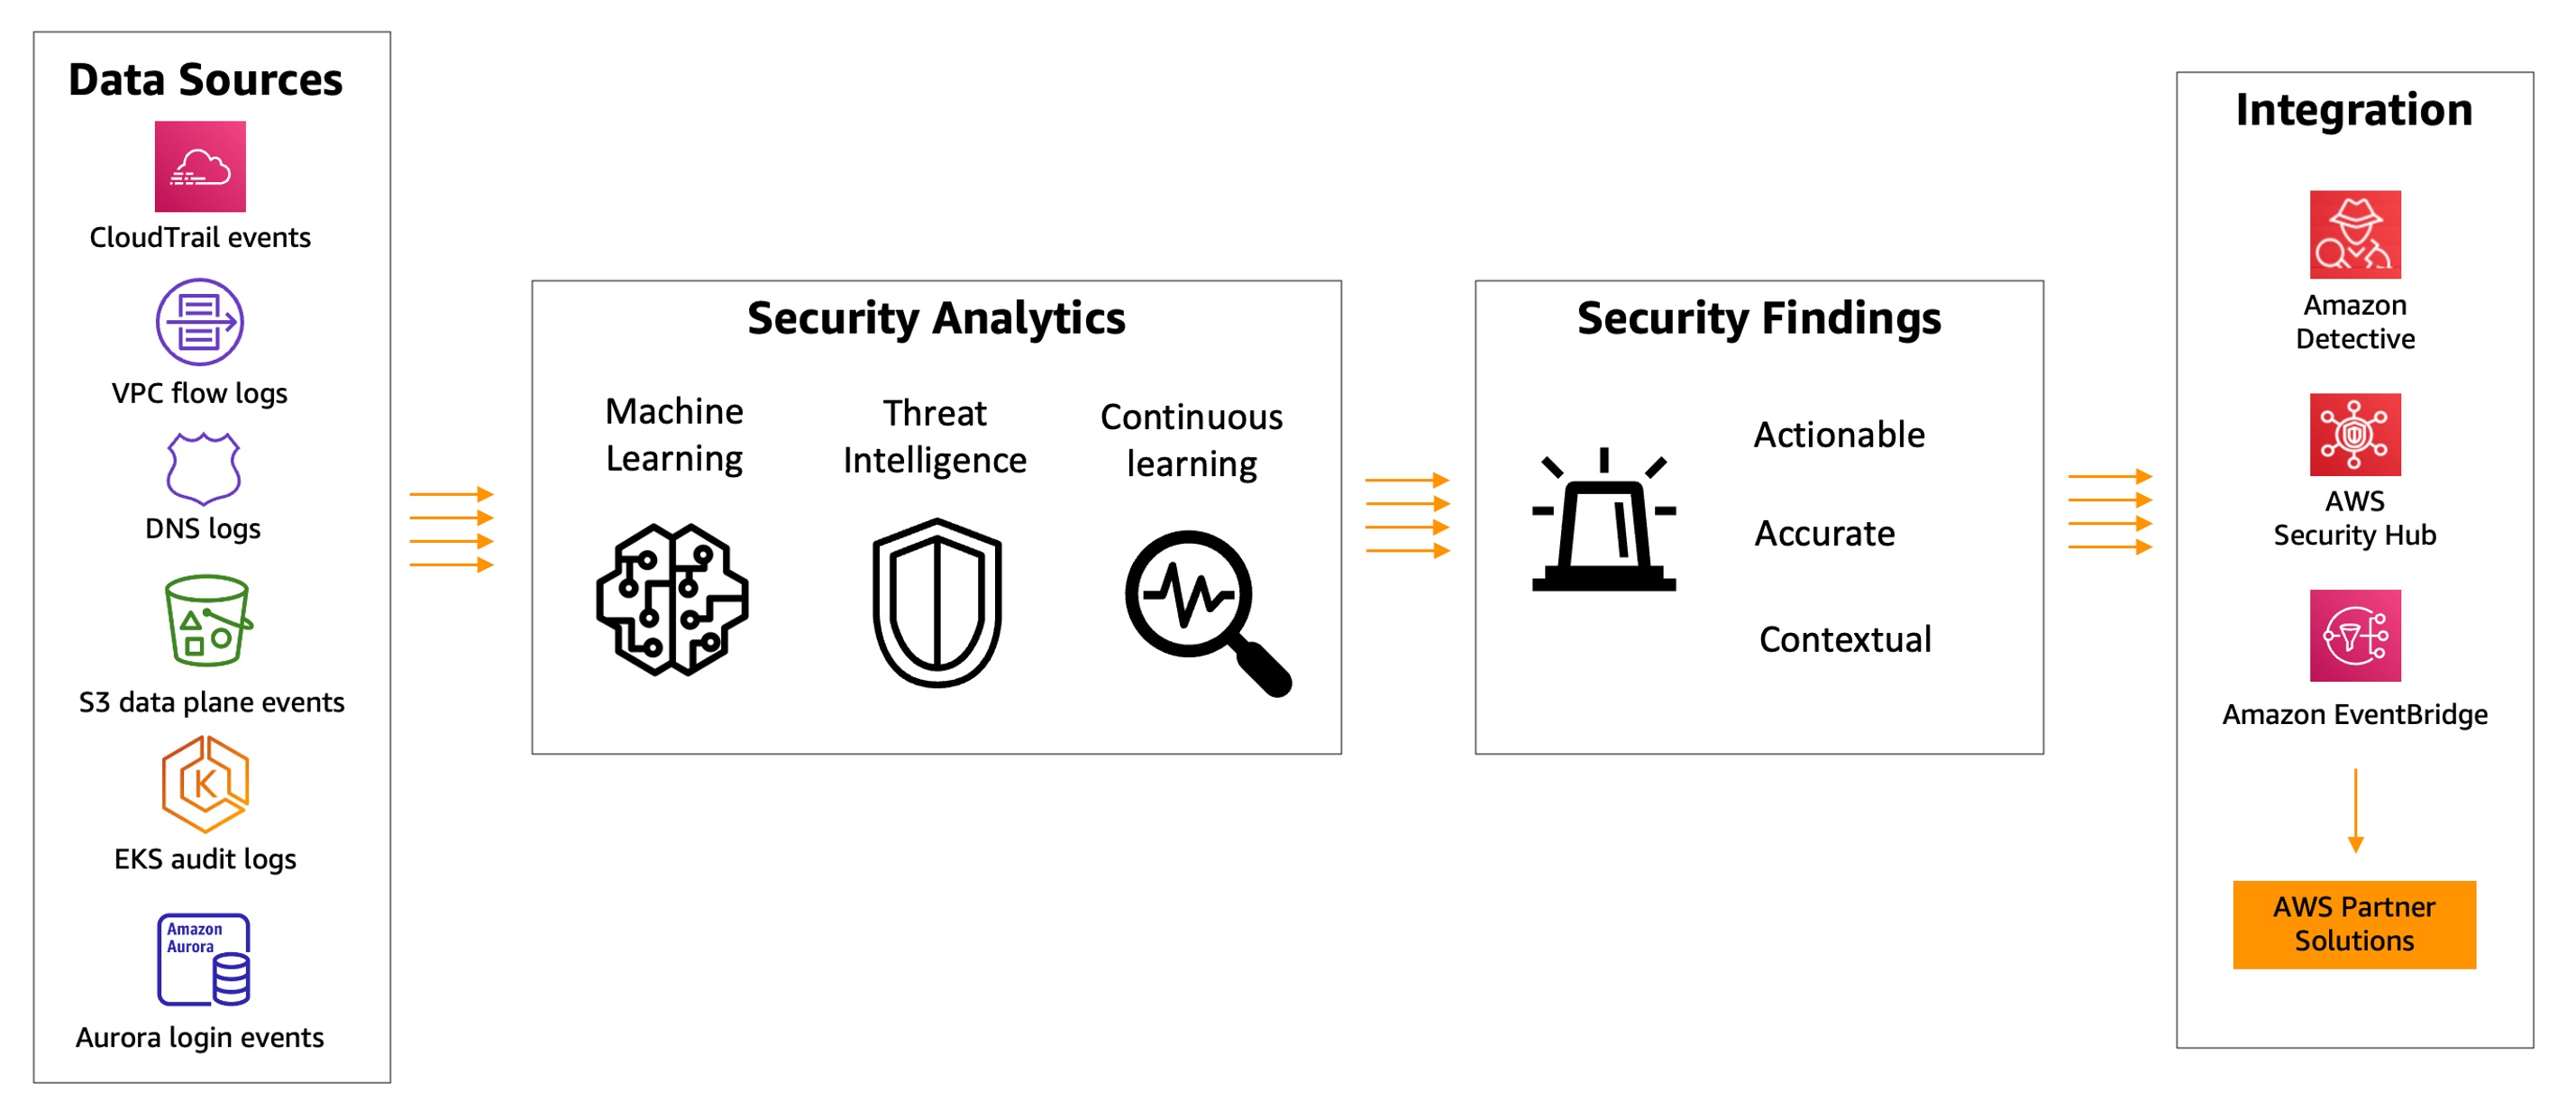
Since Amazon GuardDuty launched in 2017, GuardDuty has been capable of analyzing tens of billions of events per minute across multiple AWS data sources, such as AWS CloudTrail event logs, Amazon Virtual Private Cloud (Amazon VPC) Flow Logs, and DNS query logs, Amazon Simple Storage Service (Amazon S3) data plane events, Amazon Elastic Kubernetes Service (Amazon EKS) audit logs, and Amazon Relational Database Service (Amazon RDS) login events to protect your AWS accounts and resources.

In 2020, GuardDuty added Amazon S3 protection to continuously monitor and profile S3 data access events and configurations to detect suspicious activities in Amazon S3. Last year, GuardDuty launched Amazon EKS protection to monitor control plane activity by analyzing Kubernetes audit logs from existing and new EKS clusters in your accounts, Amazon EBS malware protection to scan malicious files residing on an EC2 instance or container workload using EBS volumes, and Amazon RDS protection to identify potential threats to data stored in Amazon Aurora databases—recently generally available.

GuardDuty combines machine learning (ML), anomaly detection, network monitoring, and malicious file discovery using various AWS data sources. When threats are detected, GuardDuty automatically sends security findings to AWS Security Hub, Amazon EventBridge, and Amazon Detective. These integrations help centralize monitoring for AWS and partner services, automate responses to malware findings, and perform security investigations from GuardDuty.

Today, we are announcing the general availability of Amazon GuardDuty EKS Runtime Monitoring to detect runtime threats from over 30 security findings to protect your EKS clusters. The new EKS Runtime Monitoring uses a fully managed EKS add-on that adds visibility into individual container runtime activities, such as file access, process execution, and network connections.

GuardDuty can now identify specific containers within your EKS clusters that are potentially compromised and detect attempts to escalate privileges from an individual container to the underlying Amazon EC2 host and the broader AWS environment. GuardDuty EKS Runtime Monitoring findings provide metadata context to identify potential threats and contain them before they escalate.

Configure EKS Runtime Monitoring in GuardDuty
To get started, first enable EKS Runtime Monitoring with just a few clicks in the GuardDuty console.

Once you enable EKS Runtime Monitoring, GuardDuty can start monitoring and analyzing the runtime-activity events for all the existing and new EKS clusters for your accounts. If you want GuardDuty to deploy and update the required EKS-managed add-on for all the existing and new EKS clusters in your account, choose Manage agent automatically. This will also create a VPC endpoint through which the security agent delivers the runtime events to GuardDuty.

If you configure EKS Audit Log Monitoring and runtime monitoring together, you can achieve optimal EKS protection both at the cluster control plane level, and down to the individual pod or container operating system level. When used together, threat detection will be more contextual to allow quick prioritization and response. For example, a runtime-based detection on a pod exhibiting suspicious behavior can be augmented by an audit log-based detection, indicating the pod was unusually launched with elevated privileges.

These options are default, but they are configurable, and you can uncheck one of the boxes in order to disable EKS Runtime Monitoring. When you disable EKS Runtime Monitoring, GuardDuty immediately stops monitoring and analyzing the runtime-activity events for all the existing EKS clusters. If you had configured automated agent management through GuardDuty, this action also removes the security agent that GuardDuty had deployed.

Manage GuardDuty Agent Manually
If you want to manually deploy and update the EKS managed add-on, including the GuardDuty agent, per cluster in your account, uncheck Manage agent automatically in the EKS protection configuration.

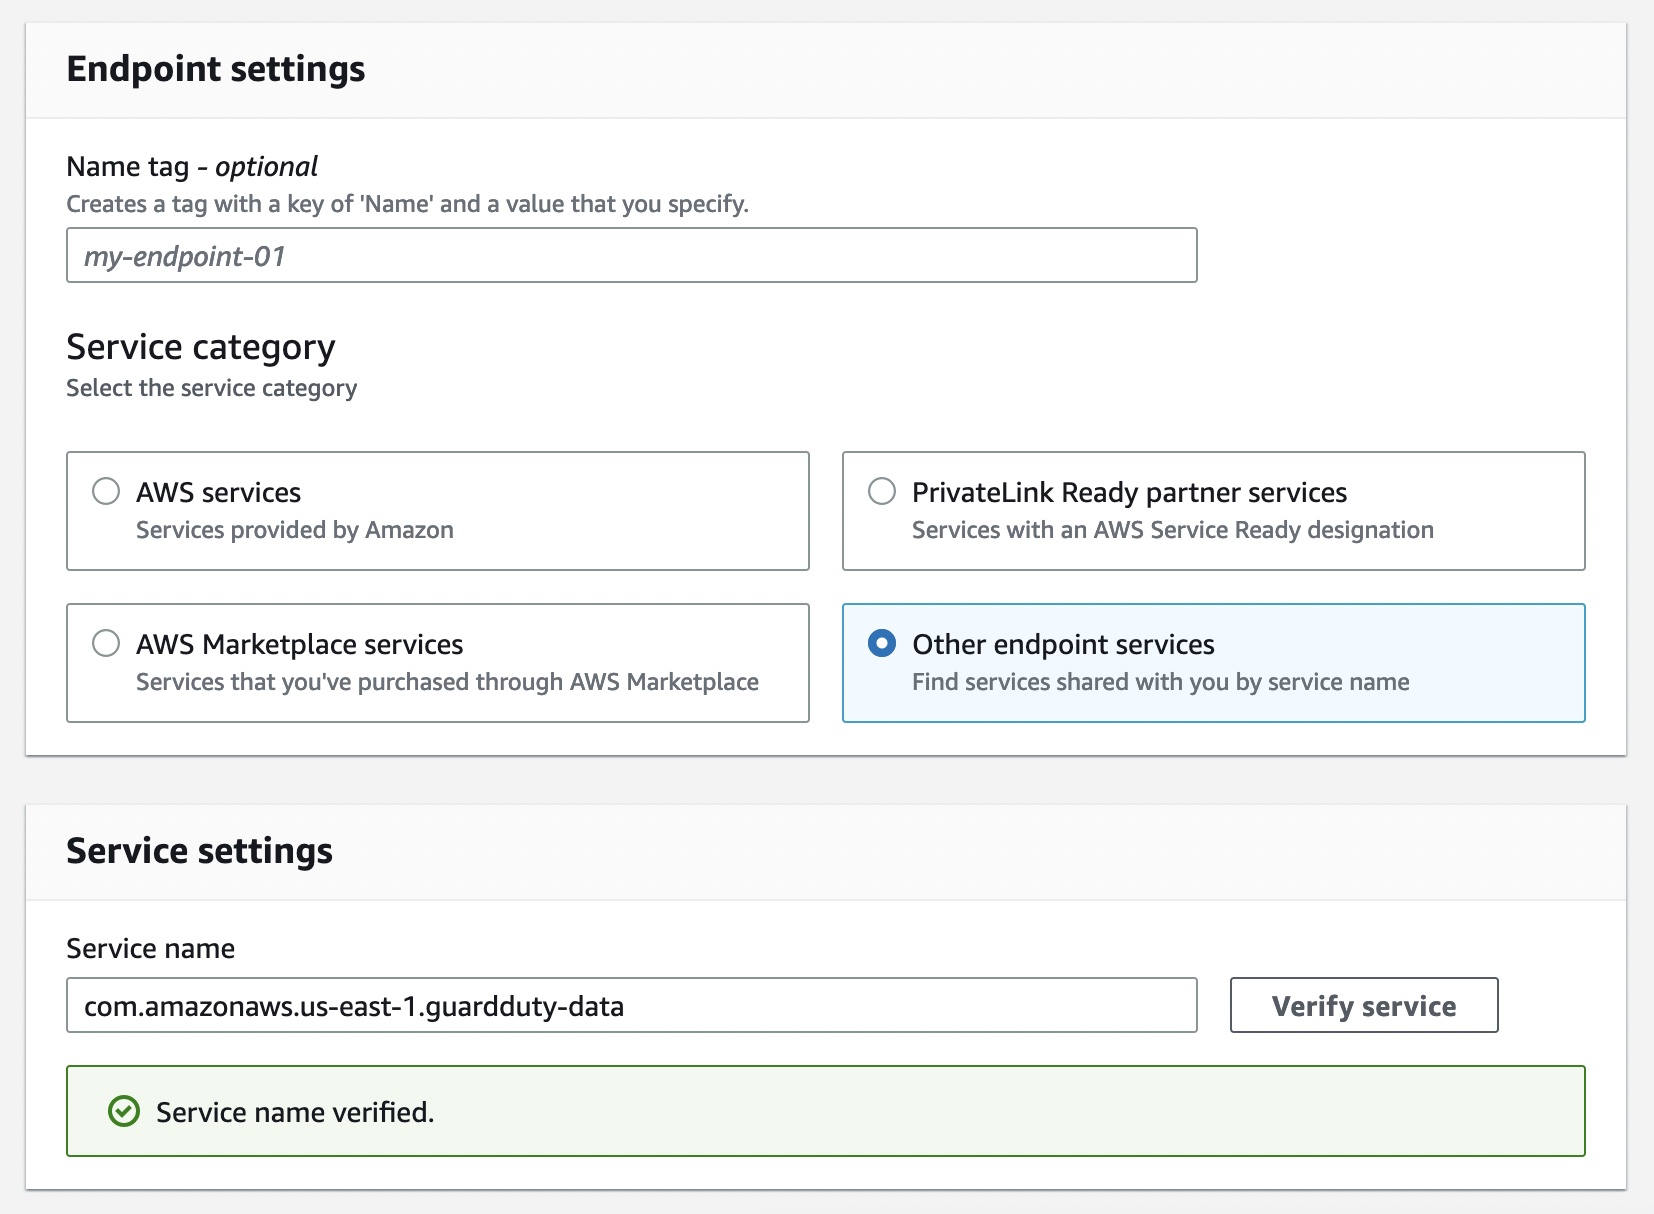
When managing the add-on manually, you are also responsible for creating the VPC endpoint through which the security agent delivers the runtime events to GuardDuty. In the VPC endpoint console, choose Create endpoint. In the step, choose Other endpoint services for Service category, enter com.amazonaws.us-east-1.guardduty-data for Service name in the US East (N. Virginia) Region, and choose Verify service.

After the service name is successfully verified, choose VPC and subnets where your EKS cluster resides. Under Additional settings, choose Enable DNS name. Under Security groups, choose a security group that has the in-bound port 443 enabled from your VPC (or your EKS cluster).

Add the following policy to restrict VPC endpoint usage to the specified account only:

{
        "Version": "2012-10-17",
        "Statement": [
                {
                        "Action": "*",
                        "Resource": "*",
                        "Effect": "Allow",
                        "Principal": "*"
                },
                {
                        "Condition": {
                                "StringNotEquals": {
                                        "aws:PrincipalAccount": "123456789012"
                                }
                        },
                        "Action": "*",
                        "Resource": "*",
                        "Effect": "Deny",
                        "Principal": "*"
                }
        ]
}

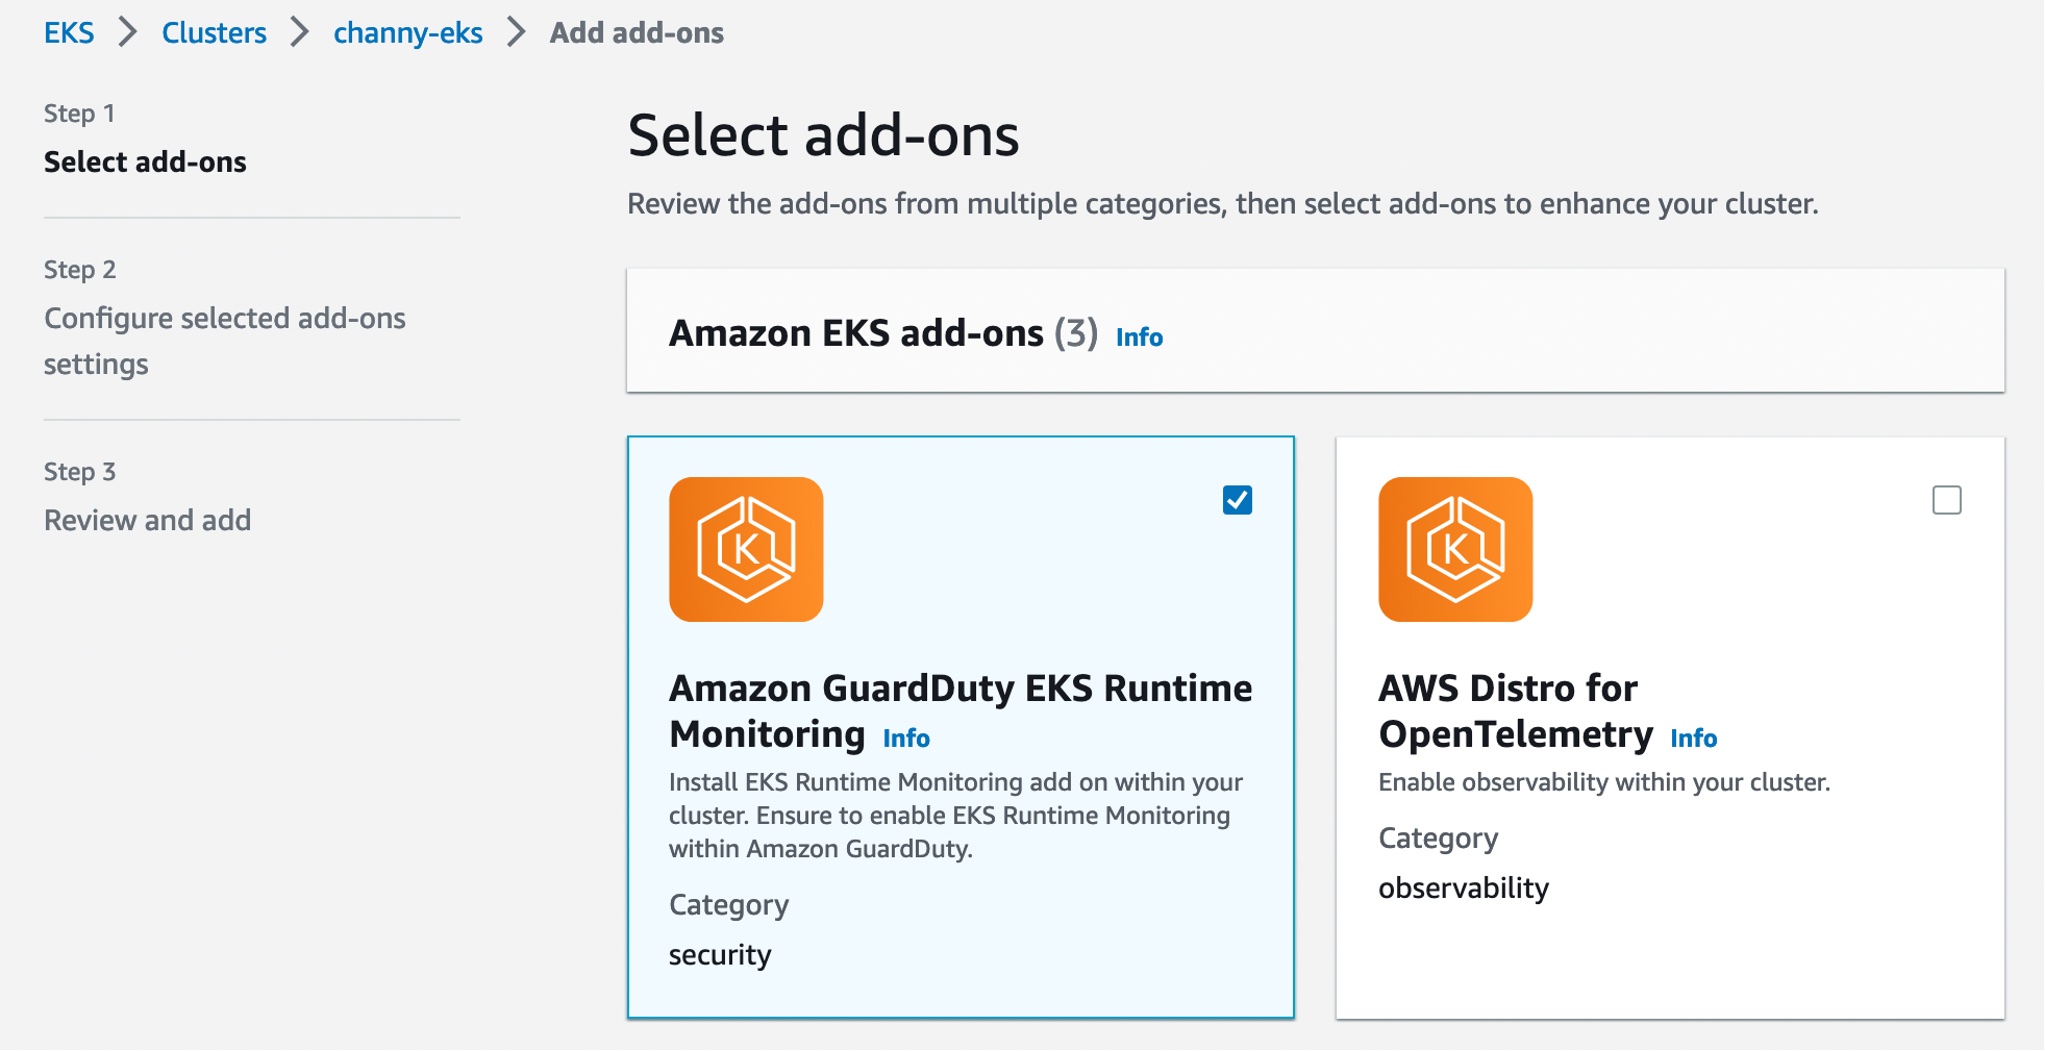
Now, you can install the Amazon GuardDuty EKS Runtime Monitoring add-on for your EKS clusters. Select this add-on in the Add-ons tab in your EKS cluster profile on the Amazon EKS console.

When you enable EKS Runtime Monitoring in GuardDuty and deploy the Amazon EKS add-on for your EKS cluster, you can view the new pods with the prefix amazon-guardduty-agent. GuardDuty now starts to consume runtime-activity events from all EC2 hosts and containers in the cluster. GuardDuty then analyzes these events for potential threats.

These pods collect various event types and send them to the GuardDuty backend for threat detection and analysis. When managing the add-on manually, you need to go through these steps for each EKS cluster that you want to monitor, including new EKS clusters. To learn more, see Managing GuardDuty agent manually in the AWS documentation.

Checkout EKS Runtime Security Findings
When GuardDuty detects a potential threat and generates a security finding, you can view the details of the corresponding findings. These security findings indicate either a compromised EC2 instance, container workload, an EKS cluster, or a set of compromised credentials in your AWS environment.

If you want to generate EKS Runtime Monitoring sample findings for testing purposes, see Generating sample findings in GuardDuty in the AWS documentation. Here is an example of potential security issues: a newly created or recently modified binary file in an EKS cluster has been executed.

The ResourceType for an EKS Protection finding type could be an Instance, EKSCluster, or Container. If the Resource type in the finding details is EKSCluster, it indicates that either a pod or a container inside an EKS cluster is potentially compromised. Depending on the potentially compromised resource type, the finding details may contain Kubernetes workload details, EKS cluster details, or instance details.

The Runtime details such as process details and any required context describe information about the observed process, and the runtime context describes any additional information about the potentially suspicious activity.

To remediate a compromised pod or container image, see Remediating Kubernetes security issues discovered by GuardDuty in the AWS documentation. This document describes the recommended remediation steps for each resource type. To learn more about security finding types, see GuardDuty EKS Runtime Monitoring finding types in the AWS documentation.

Now Available
You can now use Amazon GuardDuty for EKS Runtime Monitoring. For a full list of Regions where EKS Runtime Monitoring is available, visit region-specific feature availability.

The first 30 days of GuardDuty for EKS Runtime Monitoring are available at no additional charge for existing GuardDuty accounts. If you enabled GuardDuty for the first time, EKS Runtime Monitoring is not enabled by default, and needs to be enabled as described above. After the trial period ends in the GuardDuty, you can see the estimated cost of EKS Runtime Monitoring. To learn more, see the GuardDuty pricing page.

For more information, see the Amazon GuardDuty User Guide and send feedback to AWS re:Post for Amazon GuardDuty or through your usual AWS support contacts.

Channy


from AWS News Blog https://ift.tt/apzbGQZ
via IFTTT